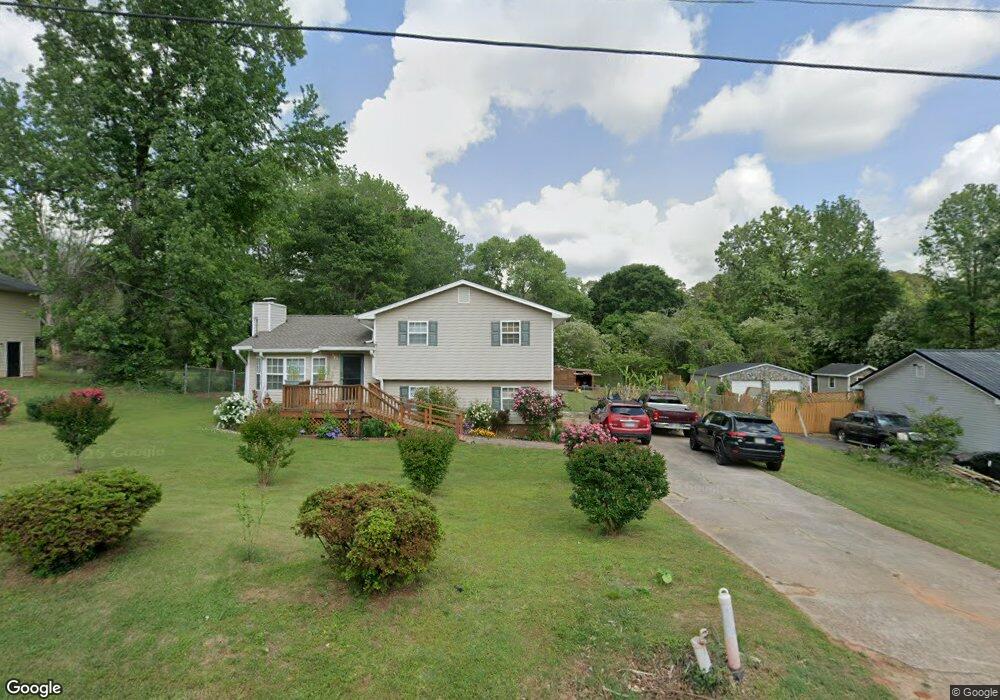
60 E Knight Dr Carrollton, GA 30116
Abilene NeighborhoodEstimated Value: $212,000 - $233,000
3
Beds
2
Baths
1,372
Sq Ft
$163/Sq Ft
Est. Value
About This Home
This home is located at 60 E Knight Dr, Carrollton, GA 30116 and is currently estimated at $223,014, approximately $162 per square foot. 60 E Knight Dr is a home located in Carroll County with nearby schools including Sharp Creek Elementary School, Bay Springs Middle School, and Villa Rica High School.
Ownership History
Date
Name
Owned For
Owner Type
Purchase Details
Closed on
Feb 16, 2007
Sold by
Boyd Timothy E
Bought by
Wadley Richard
Current Estimated Value
Home Financials for this Owner
Home Financials are based on the most recent Mortgage that was taken out on this home.
Original Mortgage
$83,500
Outstanding Balance
$49,507
Interest Rate
6.16%
Mortgage Type
New Conventional
Estimated Equity
$173,507
Purchase Details
Closed on
May 15, 2006
Sold by
Brown Theresa L
Bought by
Boyd Timothy E
Home Financials for this Owner
Home Financials are based on the most recent Mortgage that was taken out on this home.
Original Mortgage
$62,400
Interest Rate
6.41%
Mortgage Type
New Conventional
Purchase Details
Closed on
Mar 31, 1998
Sold by
Strickland Thomas L
Bought by
Brown Theresa L & Tr
Purchase Details
Closed on
Oct 25, 1996
Bought by
Strickland Thomas L
Purchase Details
Closed on
May 20, 1986
Bought by
Strickland Thomas L
Create a Home Valuation Report for This Property
The Home Valuation Report is an in-depth analysis detailing your home's value as well as a comparison with similar homes in the area
Home Values in the Area
Average Home Value in this Area
Purchase History
| Date | Buyer | Sale Price | Title Company |
|---|---|---|---|
| Wadley Richard | -- | -- | |
| Boyd Timothy E | $78,000 | -- | |
| Brown Theresa L & Tr | $69,000 | -- | |
| Strickland Thomas L | -- | -- | |
| Strickland Thomas L | -- | -- |
Source: Public Records
Mortgage History
| Date | Status | Borrower | Loan Amount |
|---|---|---|---|
| Open | Wadley Richard | $83,500 | |
| Previous Owner | Boyd Timothy E | $62,400 |
Source: Public Records
Tax History
| Year | Tax Paid | Tax Assessment Tax Assessment Total Assessment is a certain percentage of the fair market value that is determined by local assessors to be the total taxable value of land and additions on the property. | Land | Improvement |
|---|---|---|---|---|
| 2025 | $1,327 | $76,920 | $4,000 | $72,920 |
| 2024 | $1,342 | $76,920 | $4,000 | $72,920 |
| 2023 | $1,342 | $70,350 | $4,000 | $66,350 |
| 2022 | $1,118 | $57,253 | $4,000 | $53,253 |
| 2021 | $1,010 | $49,719 | $4,000 | $45,719 |
| 2020 | $911 | $44,146 | $4,000 | $40,146 |
| 2019 | $857 | $40,877 | $4,000 | $36,877 |
| 2018 | $770 | $35,515 | $4,000 | $31,515 |
| 2017 | $684 | $30,626 | $4,000 | $26,626 |
| 2016 | $684 | $30,626 | $4,000 | $26,626 |
| 2015 | $687 | $28,563 | $4,000 | $24,563 |
| 2014 | $690 | $28,563 | $4,000 | $24,563 |
Source: Public Records
Map
Nearby Homes
- 10 King Dr
- 0 Knight Dr W
- 0 Old Airport Rd Unit 10599783
- 0 Old Airport Rd Unit 7642238
- 0 Old Airport Rd Unit 7642301
- 0 Old Airport Rd Unit 7642336
- 0 Old Airport Rd Unit 10599779
- 204 Asher Dr
- 255 Morgan D2 Rd
- 255 Morgan Rd
- 0 Shady Grove Rd Unit 10601173
- 0 Shady Grove Rd Unit 10601172
- 310 Turtle Pointe Dr
- 211 Stoney Point Cove
- 131 Hunter Way
- 90 Oak Ridge Dr
- 00 Old Airport Rd
- 108 Hunter Way
- 124 Betty Ln
- 825 Frashier Rd
- 50 E Knight Dr
- 70 E Knight Dr
- 78 E Knight Dr
- 65 Knights Dr E
- 40 E Knight Dr
- 80 E Knight Dr
- 65 E Knight Dr
- 55 E Knight Dr
- 75 E Knight Dr
- 30 E Knight Dr
- 90 E Knight Dr
- 25 E Knight Dr
- 80 W Knight Dr
- 70 W Knight Dr
- 90 W Knight Dr
- 20 E Knight Dr
- 20 King Dr
- 60 W Knight Dr
- 52 Poplar Point Dr
- 34 Poplar Point Dr
Your Personal Tour Guide
Ask me questions while you tour the home.