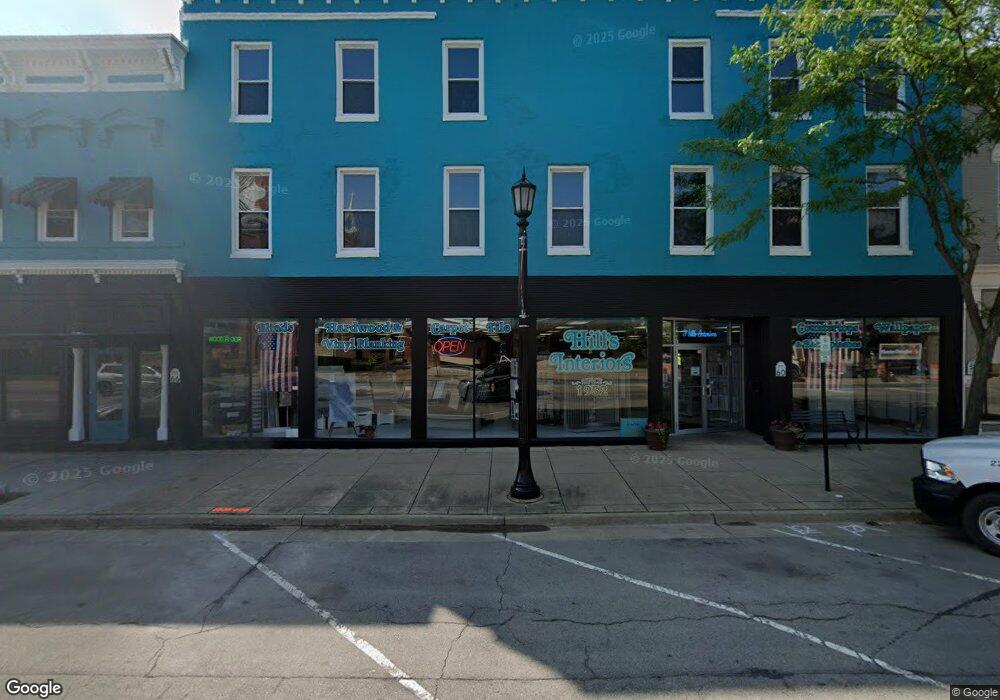
60 E Main St Norwalk, OH 44857
--
Bed
--
Bath
3,072
Sq Ft
0.33
Acres
About This Home
This home is located at 60 E Main St, Norwalk, OH 44857. 60 E Main St is a home located in Huron County with nearby schools including Maplehurst Elementary School, League Elementary School, and Pleasant Elementary School.
Ownership History
Date
Name
Owned For
Owner Type
Purchase Details
Closed on
Jun 5, 2024
Sold by
Hills Interiors Llc
Bought by
Mark Silverwood Properties Llc
Home Financials for this Owner
Home Financials are based on the most recent Mortgage that was taken out on this home.
Original Mortgage
$500,000
Outstanding Balance
$474,424
Interest Rate
7.38%
Mortgage Type
New Conventional
Purchase Details
Closed on
May 7, 2024
Sold by
Graves James H and Graves Susan M
Bought by
Hills Interiors Llc
Home Financials for this Owner
Home Financials are based on the most recent Mortgage that was taken out on this home.
Original Mortgage
$500,000
Outstanding Balance
$474,424
Interest Rate
7.38%
Mortgage Type
New Conventional
Purchase Details
Closed on
Apr 7, 2006
Bought by
Graves James H and Graves Susan M
Purchase Details
Closed on
Aug 4, 2005
Bought by
Asbury Daniel R
Purchase Details
Closed on
Sep 10, 2003
Bought by
Terry Virginia L
Purchase Details
Closed on
Jan 2, 1990
Bought by
Terry Wilbur D
Create a Home Valuation Report for This Property
The Home Valuation Report is an in-depth analysis detailing your home's value as well as a comparison with similar homes in the area
Home Values in the Area
Average Home Value in this Area
Purchase History
| Date | Buyer | Sale Price | Title Company |
|---|---|---|---|
| Mark Silverwood Properties Llc | -- | Tucker Escrow & Title | |
| Hills Interiors Llc | $625,000 | Tucker Escrow & Title | |
| Graves James H | $130,000 | -- | |
| Asbury Daniel R | $140,000 | -- | |
| Terry Virginia L | -- | -- | |
| Terry Wilbur D | $100,000 | -- |
Source: Public Records
Mortgage History
| Date | Status | Borrower | Loan Amount |
|---|---|---|---|
| Open | Hills Interiors Llc | $500,000 |
Source: Public Records
Tax History Compared to Growth
Tax History
| Year | Tax Paid | Tax Assessment Tax Assessment Total Assessment is a certain percentage of the fair market value that is determined by local assessors to be the total taxable value of land and additions on the property. | Land | Improvement |
|---|---|---|---|---|
| 2024 | $2,866 | $58,760 | $5,820 | $52,940 |
| 2023 | $2,866 | $53,460 | $8,550 | $44,910 |
| 2022 | $2,686 | $53,460 | $8,550 | $44,910 |
| 2021 | $2,690 | $53,460 | $8,550 | $44,910 |
| 2020 | $3,116 | $58,730 | $8,550 | $50,180 |
| 2019 | $3,100 | $58,730 | $8,550 | $50,180 |
| 2018 | $3,057 | $58,730 | $8,550 | $50,180 |
| 2017 | $2,353 | $45,270 | $7,950 | $37,320 |
| 2016 | $2,334 | $45,270 | $7,950 | $37,320 |
| 2015 | $2,334 | $45,280 | $7,960 | $37,320 |
| 2014 | $2,219 | $45,300 | $7,950 | $37,350 |
| 2013 | $2,637 | $45,300 | $7,950 | $37,350 |
Source: Public Records
Map
Nearby Homes