60 E Spring St Columbus, OH 43215
Uptown District NeighborhoodEstimated Value: $133,000 - $186,000
1
Bed
1
Bath
570
Sq Ft
$298/Sq Ft
Est. Value
About This Home
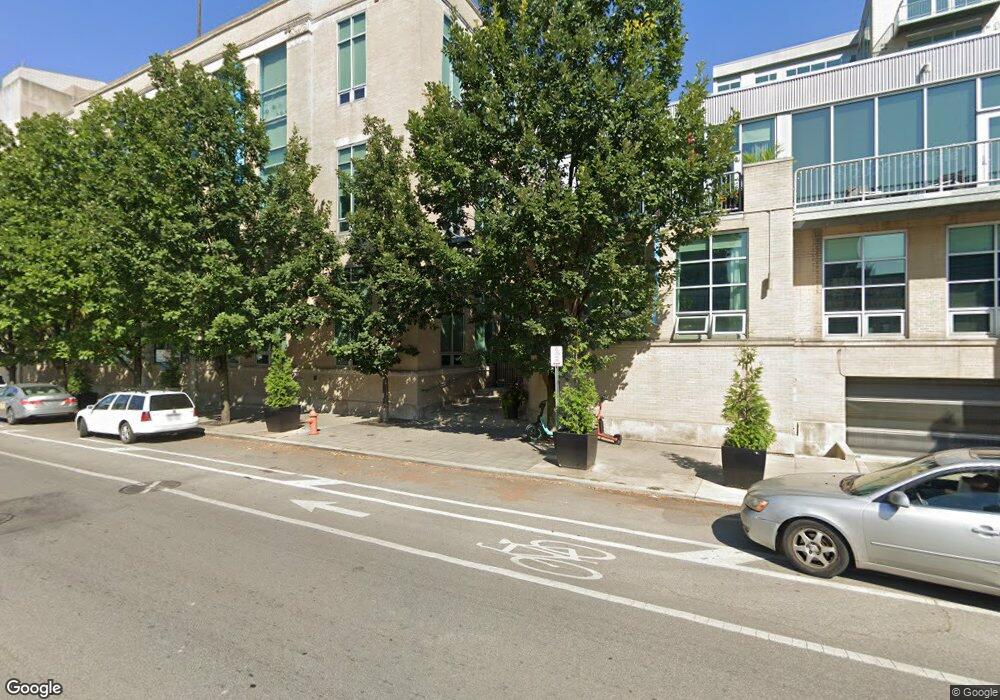
This home is located at 60 E Spring St, Columbus, OH 43215 and is currently estimated at $169,933, approximately $298 per square foot. 60 E Spring St is a home located in Franklin County with nearby schools including Hubbard Elementary School, Dominion Middle School, and Whetstone High School.
Ownership History
Date
Name
Owned For
Owner Type
Purchase Details
Closed on
Jul 11, 2022
Sold by
Bartola Samuel Lawrence
Bought by
Justin Mengjie Wang And Jinhui June Wang Fami and Wang
Current Estimated Value
Purchase Details
Closed on
Dec 30, 2019
Sold by
Mccourt David
Bought by
Bartola Samuel Lawrence
Home Financials for this Owner
Home Financials are based on the most recent Mortgage that was taken out on this home.
Original Mortgage
$128,250
Interest Rate
3.6%
Mortgage Type
New Conventional
Purchase Details
Closed on
Feb 28, 2006
Sold by
Jds Spring Llc
Bought by
Mccourt David B
Home Financials for this Owner
Home Financials are based on the most recent Mortgage that was taken out on this home.
Original Mortgage
$95,200
Interest Rate
3.25%
Mortgage Type
Fannie Mae Freddie Mac
Create a Home Valuation Report for This Property
The Home Valuation Report is an in-depth analysis detailing your home's value as well as a comparison with similar homes in the area
Home Values in the Area
Average Home Value in this Area
Purchase History
| Date | Buyer | Sale Price | Title Company |
|---|---|---|---|
| Justin Mengjie Wang And Jinhui June Wang Fami | $149,000 | Stewart Title | |
| Bartola Samuel Lawrence | $135,000 | Amerititle Downtown | |
| Mccourt David B | $119,000 | Hummel Titl |
Source: Public Records
Mortgage History
| Date | Status | Borrower | Loan Amount |
|---|---|---|---|
| Previous Owner | Bartola Samuel Lawrence | $128,250 | |
| Previous Owner | Mccourt David B | $95,200 |
Source: Public Records
Tax History
| Year | Tax Paid | Tax Assessment Tax Assessment Total Assessment is a certain percentage of the fair market value that is determined by local assessors to be the total taxable value of land and additions on the property. | Land | Improvement |
|---|---|---|---|---|
| 2025 | $1,830 | $39,310 | $4,130 | $35,180 |
| 2024 | $1,830 | $39,310 | $4,130 | $35,180 |
| 2023 | $1,805 | $39,305 | $4,130 | $35,175 |
| 2022 | $2,257 | $42,320 | $3,610 | $38,710 |
| 2021 | $2,259 | $42,320 | $3,610 | $38,710 |
| 2020 | $2,256 | $42,320 | $3,610 | $38,710 |
| 2019 | $2,938 | $45,920 | $3,990 | $41,930 |
| 2018 | $1,632 | $45,920 | $3,990 | $41,930 |
| 2017 | $364 | $45,930 | $3,990 | $41,940 |
| 2016 | $343 | $45,850 | $2,940 | $42,910 |
| 2015 | $225 | $45,850 | $2,940 | $42,910 |
| 2014 | $226 | $45,850 | $2,940 | $42,910 |
| 2013 | $159 | $3,640 | $2,940 | $700 |
Source: Public Records
Map
Nearby Homes
- 60 E Spring St Unit 601
- 60 E Spring St Unit 412
- 106 E Lafayette St
- 78 E Chestnut St Unit 608
- 78 E Chestnut St Unit 107
- 78 E Chestnut St Unit 404
- 225 N 4th St Unit 303
- 225 N 4th St Unit 301
- 106 N High St Unit 603
- 106 N High St Unit 105
- 106 N High St Unit 302
- 110 N 3rd St Unit 606
- 110 N 3rd St Unit 604
- 110 N 3rd St Unit 601
- 100 E Gay St Unit 303
- 100 E Gay St Unit 804
- 100 E Gay St Unit 503
- 51 N High St Unit 607
- 51 N High St Unit 508
- 51 N High St Unit 506
Your Personal Tour Guide
Ask me questions while you tour the home.