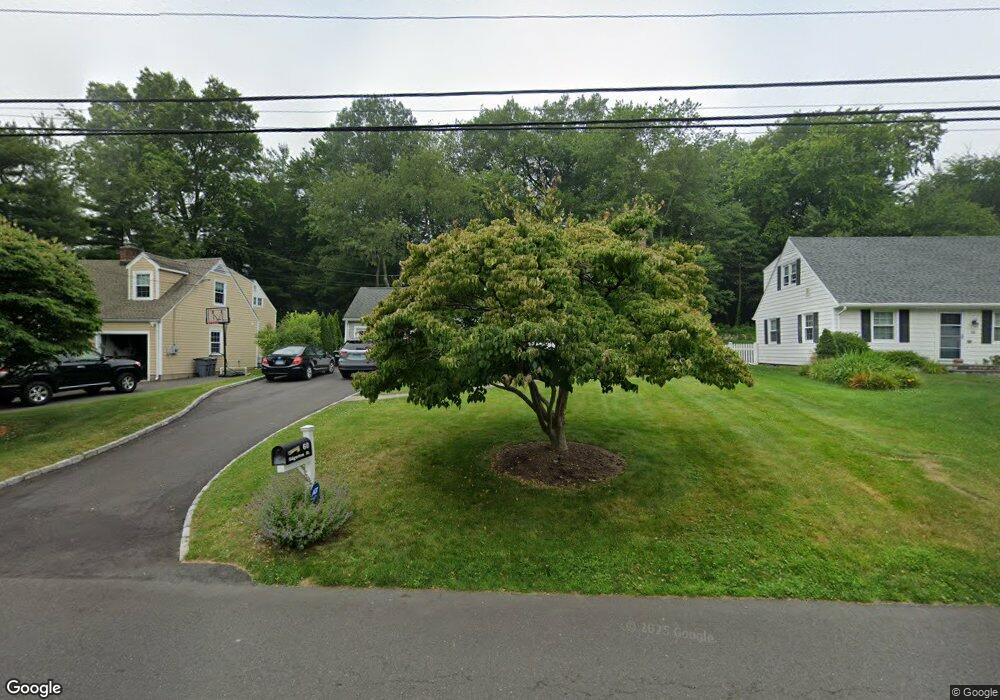
60 Edgerton St Darien, CT 06820
Estimated Value: $1,604,298 - $1,701,000
4
Beds
3
Baths
2,125
Sq Ft
$775/Sq Ft
Est. Value
About This Home
This home is located at 60 Edgerton St, Darien, CT 06820 and is currently estimated at $1,646,575, approximately $774 per square foot. 60 Edgerton St is a home located in Fairfield County with nearby schools including Royle Elementary School, Middlesex Middle School, and Darien High School.
Ownership History
Date
Name
Owned For
Owner Type
Purchase Details
Closed on
Jul 6, 2015
Sold by
Brown David C and Brown Lori A
Bought by
Frey Christopher L and Frey Lindsay R
Current Estimated Value
Home Financials for this Owner
Home Financials are based on the most recent Mortgage that was taken out on this home.
Original Mortgage
$744,000
Outstanding Balance
$579,518
Interest Rate
3.83%
Estimated Equity
$1,067,057
Purchase Details
Closed on
Nov 3, 2006
Sold by
Hamblett Amy and Hathaway Michael Andrew
Bought by
Brown David C and Brown Lori A
Create a Home Valuation Report for This Property
The Home Valuation Report is an in-depth analysis detailing your home's value as well as a comparison with similar homes in the area
Home Values in the Area
Average Home Value in this Area
Purchase History
| Date | Buyer | Sale Price | Title Company |
|---|---|---|---|
| Frey Christopher L | $930,000 | -- | |
| Brown David C | $600,000 | -- |
Source: Public Records
Mortgage History
| Date | Status | Borrower | Loan Amount |
|---|---|---|---|
| Open | Brown David C | $744,000 | |
| Previous Owner | Brown David C | $29,300 | |
| Previous Owner | Brown David C | $575,000 | |
| Previous Owner | Brown David C | $50,000 |
Source: Public Records
Tax History Compared to Growth
Tax History
| Year | Tax Paid | Tax Assessment Tax Assessment Total Assessment is a certain percentage of the fair market value that is determined by local assessors to be the total taxable value of land and additions on the property. | Land | Improvement |
|---|---|---|---|---|
| 2025 | $12,330 | $796,530 | $543,060 | $253,470 |
| 2024 | $11,701 | $796,530 | $543,060 | $253,470 |
| 2023 | $10,512 | $596,960 | $417,760 | $179,200 |
| 2022 | $10,286 | $596,960 | $417,760 | $179,200 |
| 2021 | $52,122 | $596,960 | $417,760 | $179,200 |
| 2020 | $9,766 | $596,960 | $417,760 | $179,200 |
| 2019 | $9,861 | $598,710 | $417,760 | $180,950 |
| 2018 | $50,344 | $552,090 | $368,900 | $183,190 |
| 2017 | $8,922 | $552,090 | $368,900 | $183,190 |
| 2016 | $8,706 | $552,090 | $368,900 | $183,190 |
| 2015 | $8,475 | $552,090 | $368,900 | $183,190 |
| 2014 | $8,287 | $552,090 | $368,900 | $183,190 |
Source: Public Records
Map
Nearby Homes
- 166 Hollow Tree Ridge Rd
- 39 Noroton Ave
- 19 William St
- 77 Maple St
- 333 West Ave Unit 3
- 261 Hollow Tree Ridge Rd
- 311 Noroton Ave
- 53 Noroton Ave
- 45 Hecker Ave
- 47 Hollow Tree Ridge Rd
- 76 Deepwood Rd
- 130 West Ave
- 98 Holmes Ave
- 128 West Ave
- 415 West Ave
- 19 Anthony Ln
- 90 Courtland Hill St
- 88 Maple Tree Ave Unit G
- 69 Maple Tree Ave Unit 4
- 10 Stony Brook Rd