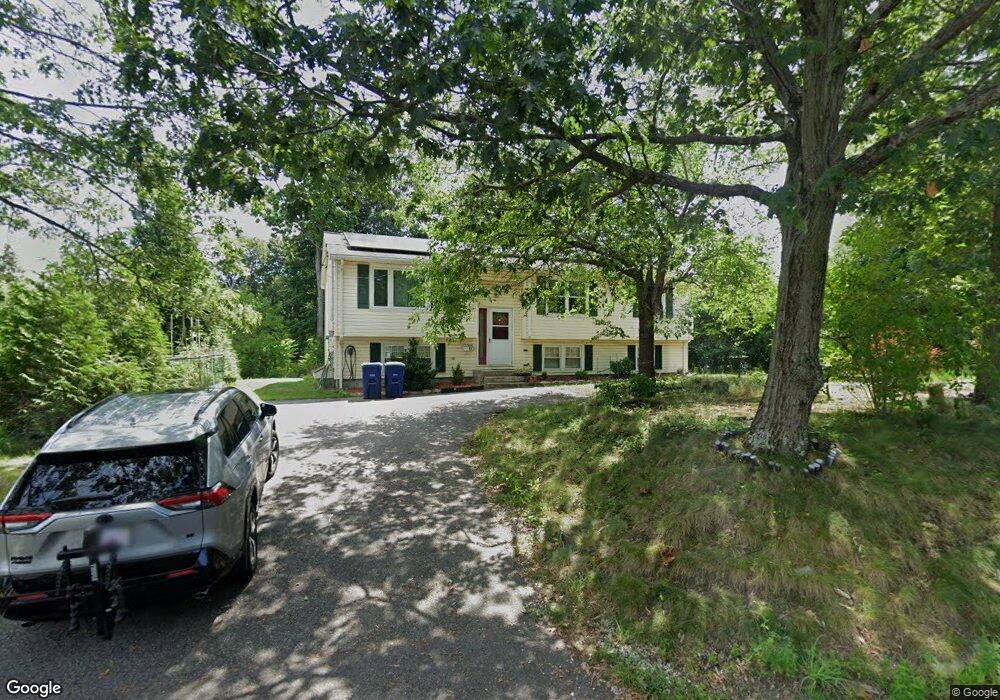
60 Elliot St Braintree, MA 02184
Weymouth Landing NeighborhoodEstimated Value: $716,000 - $833,000
3
Beds
2
Baths
2,156
Sq Ft
$355/Sq Ft
Est. Value
About This Home
This home is located at 60 Elliot St, Braintree, MA 02184 and is currently estimated at $764,550, approximately $354 per square foot. 60 Elliot St is a home located in Norfolk County with nearby schools including Sacred Heart Elementary School and South Shore Christian Academy.
Ownership History
Date
Name
Owned For
Owner Type
Purchase Details
Closed on
Mar 7, 2006
Sold by
Chan Kam M and Kam Lan S
Bought by
Mihalev Atanas H and Mihaleva Mariela
Current Estimated Value
Purchase Details
Closed on
Apr 15, 1998
Sold by
Mitchell Lawrence F
Bought by
Kam Lan S
Create a Home Valuation Report for This Property
The Home Valuation Report is an in-depth analysis detailing your home's value as well as a comparison with similar homes in the area
Home Values in the Area
Average Home Value in this Area
Purchase History
| Date | Buyer | Sale Price | Title Company |
|---|---|---|---|
| Mihalev Atanas H | $450,000 | -- | |
| Kam Lan S | $184,000 | -- | |
| Kam Lan S | $184,000 | -- |
Source: Public Records
Mortgage History
| Date | Status | Borrower | Loan Amount |
|---|---|---|---|
| Open | Kam Lan S | $299,500 | |
| Closed | Kam Lan S | $302,400 |
Source: Public Records
Tax History Compared to Growth
Tax History
| Year | Tax Paid | Tax Assessment Tax Assessment Total Assessment is a certain percentage of the fair market value that is determined by local assessors to be the total taxable value of land and additions on the property. | Land | Improvement |
|---|---|---|---|---|
| 2025 | $6,672 | $668,500 | $388,500 | $280,000 |
| 2024 | $6,044 | $637,500 | $362,300 | $275,200 |
| 2023 | $5,702 | $584,200 | $325,500 | $258,700 |
| 2022 | $5,499 | $552,700 | $294,000 | $258,700 |
| 2021 | $5,135 | $516,100 | $265,700 | $250,400 |
| 2020 | $4,850 | $491,900 | $241,500 | $250,400 |
| 2019 | $4,669 | $462,700 | $231,000 | $231,700 |
| 2018 | $4,547 | $431,400 | $210,000 | $221,400 |
| 2017 | $4,392 | $408,900 | $199,500 | $209,400 |
| 2016 | $4,069 | $370,600 | $168,000 | $202,600 |
| 2015 | $4,139 | $373,900 | $165,900 | $208,000 |
| 2014 | $3,810 | $333,600 | $151,200 | $182,400 |
Source: Public Records
Map
Nearby Homes
- 15 Summer St
- 36 Brookside Rd
- 37 Lantern Ln
- 122 Washington St Unit 22
- 11 Richmond St
- 51 Faxon St
- 16 Lindbergh Ave
- 23-25 Lindbergh Ave
- 76 Kingman St
- 141 Commercial St Unit 9
- 97 Liberty St
- 114 Broad St Unit D
- 114 Broad St Unit C
- 685 Union St
- 19 Vine St Unit 3
- 19 Vine St Unit 1
- 33 Congress St
- 230 Lisle St
- 48 Apple Tree Ln
- 24 Blake Rd
- 28 Sterling Park
- 70 Elliot St
- 46 Elliot St
- 36 Elliot St
- 67 Elliot St
- 63 Elliot St
- 22 Sterling Park
- 59 Elliot St
- 57 Williams St
- 32 Elliot St
- 55 Elliot St
- 53 Williams St
- 53 Williams St Unit 2
- 53 Williams St Unit 1
- 14 Sterling Park
- 26 Elliot St
- 49 Williams St
- 31 Elliot St Unit 31
- 57 Elmwood Park
- 29-31 Elliot St