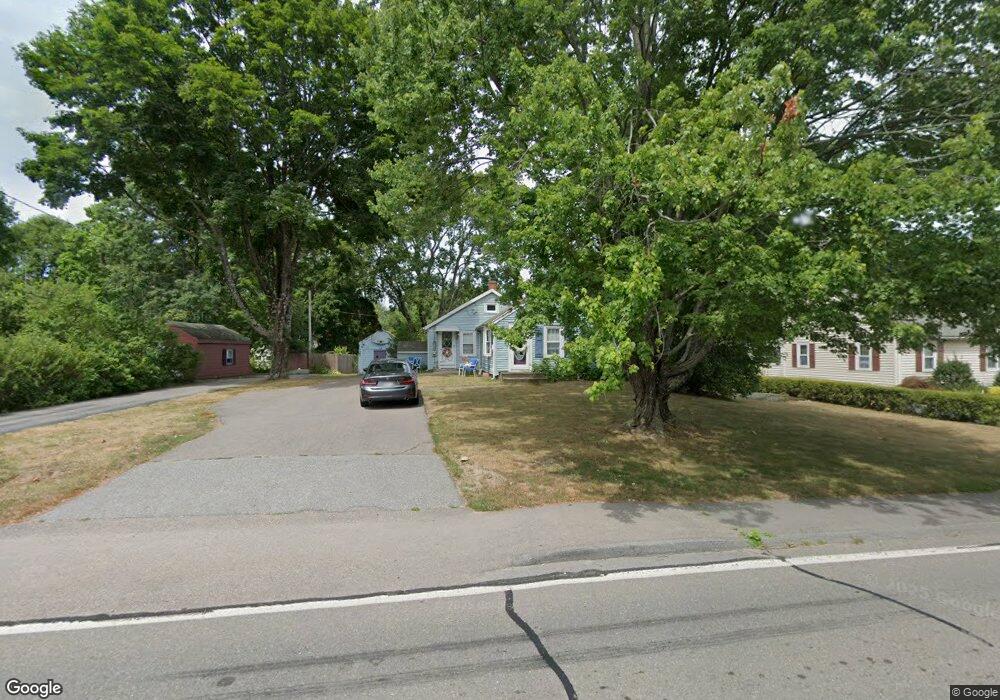
60 Elm St Hopkinton, MA 01748
Estimated Value: $410,000 - $594,000
3
Beds
1
Bath
1,019
Sq Ft
$507/Sq Ft
Est. Value
About This Home
This home is located at 60 Elm St, Hopkinton, MA 01748 and is currently estimated at $516,699, approximately $507 per square foot. 60 Elm St is a home located in Middlesex County with nearby schools including Elmwood Elementary School, Hopkins Elementary School, and Marathon Elementary School.
Ownership History
Date
Name
Owned For
Owner Type
Purchase Details
Closed on
Dec 22, 2009
Sold by
Nickless David M and Tripp Gary E
Bought by
Tripp Kathleen E
Current Estimated Value
Purchase Details
Closed on
Dec 21, 1990
Sold by
Elmwood Rlty Assocs
Bought by
Tripp Gary E
Create a Home Valuation Report for This Property
The Home Valuation Report is an in-depth analysis detailing your home's value as well as a comparison with similar homes in the area
Home Values in the Area
Average Home Value in this Area
Purchase History
| Date | Buyer | Sale Price | Title Company |
|---|---|---|---|
| Tripp Kathleen E | $10,000 | -- | |
| Tripp Gary E | $101,000 | -- |
Source: Public Records
Mortgage History
| Date | Status | Borrower | Loan Amount |
|---|---|---|---|
| Previous Owner | Tripp Gary E | $162,000 | |
| Previous Owner | Tripp Gary E | $43,316 | |
| Previous Owner | Tripp Gary E | $25,000 | |
| Previous Owner | Tripp Gary E | $101,482 |
Source: Public Records
Tax History Compared to Growth
Tax History
| Year | Tax Paid | Tax Assessment Tax Assessment Total Assessment is a certain percentage of the fair market value that is determined by local assessors to be the total taxable value of land and additions on the property. | Land | Improvement |
|---|---|---|---|---|
| 2025 | $6,290 | $443,600 | $278,500 | $165,100 |
| 2024 | $6,170 | $422,300 | $265,000 | $157,300 |
| 2023 | $5,981 | $378,300 | $232,600 | $145,700 |
| 2022 | $5,852 | $343,600 | $211,300 | $132,300 |
| 2021 | $5,664 | $331,600 | $205,000 | $126,600 |
| 2020 | $5,389 | $320,400 | $200,200 | $120,200 |
| 2019 | $5,218 | $303,900 | $196,300 | $107,600 |
| 2018 | $4,958 | $293,400 | $186,800 | $106,600 |
| 2017 | $4,783 | $284,700 | $181,300 | $103,400 |
| 2016 | $4,724 | $277,400 | $177,700 | $99,700 |
| 2015 | $4,736 | $263,700 | $172,600 | $91,100 |
Source: Public Records
Map
Nearby Homes