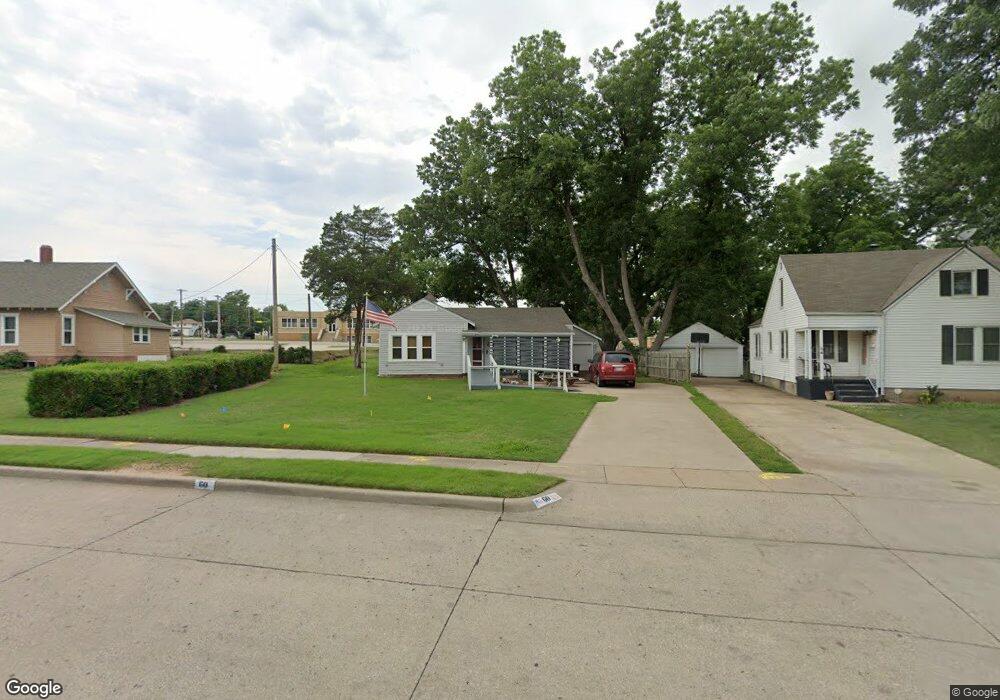
60 Elmwood Ave Ponca City, OK 74601
Estimated Value: $133,411 - $149,000
3
Beds
1
Bath
1,598
Sq Ft
$90/Sq Ft
Est. Value
About This Home
This home is located at 60 Elmwood Ave, Ponca City, OK 74601 and is currently estimated at $143,353, approximately $89 per square foot. 60 Elmwood Ave is a home located in Kay County with nearby schools including Roosevelt Elementary School, Ponca City East Middle School, and Ponca City West Middle School.
Ownership History
Date
Name
Owned For
Owner Type
Purchase Details
Closed on
Apr 24, 2017
Sold by
Hoddy Justin Glynn
Bought by
Anderson Alicia Ann
Current Estimated Value
Purchase Details
Closed on
Dec 13, 2016
Sold by
Wells Fargo Bank Na
Bought by
Hoddy Justin Glynn and Anderson Alicia Ann
Purchase Details
Closed on
May 16, 2016
Sold by
Usry Kevin Lynn and Usry Karey Ann
Bought by
Wells Fargo Bank N A
Purchase Details
Closed on
Jan 14, 2014
Sold by
Usry Deborah Ann and Usry Deborah A
Bought by
Usry Kevin Lynn
Purchase Details
Closed on
Jan 29, 2002
Sold by
George Schwarz
Bought by
Karey Kevin and Karey Usry
Purchase Details
Closed on
Oct 7, 1999
Sold by
William Willoughby
Bought by
George E Schwarz
Purchase Details
Closed on
Jul 9, 1999
Sold by
Jenny William and Jenny Willoughb
Bought by
William Willoughby
Purchase Details
Closed on
Apr 3, 1985
Sold by
Bernice Clemens
Bought by
Willo William J and Willo Jenny H
Create a Home Valuation Report for This Property
The Home Valuation Report is an in-depth analysis detailing your home's value as well as a comparison with similar homes in the area
Home Values in the Area
Average Home Value in this Area
Purchase History
| Date | Buyer | Sale Price | Title Company |
|---|---|---|---|
| Anderson Alicia Ann | -- | None Available | |
| Hoddy Justin Glynn | $33,500 | None Available | |
| Wells Fargo Bank N A | $43,265 | None Available | |
| Usry Kevin Lynn | -- | None Available | |
| Karey Kevin | $81,000 | -- | |
| George E Schwarz | $22,000 | -- | |
| William Willoughby | -- | -- | |
| Willo William J | $51,400 | -- |
Source: Public Records
Tax History Compared to Growth
Tax History
| Year | Tax Paid | Tax Assessment Tax Assessment Total Assessment is a certain percentage of the fair market value that is determined by local assessors to be the total taxable value of land and additions on the property. | Land | Improvement |
|---|---|---|---|---|
| 2024 | $646 | $8,826 | $913 | $7,913 |
| 2023 | $646 | $6,881 | $913 | $5,968 |
| 2022 | $541 | $6,681 | $913 | $5,768 |
| 2021 | $448 | $6,681 | $913 | $5,768 |
| 2020 | $440 | $6,649 | $913 | $5,736 |
| 2019 | $521 | $6,455 | $913 | $5,542 |
| 2018 | $533 | $6,502 | $913 | $5,589 |
| 2017 | $539 | $6,502 | $913 | $5,589 |
| 2016 | $655 | $6,611 | $913 | $5,698 |
| 2015 | $663 | $6,661 | $913 | $5,748 |
| 2014 | $676 | $6,927 | $913 | $6,014 |
Source: Public Records
Map
Nearby Homes
- 214 Virginia Ave
- 525 Monument Rd
- 213 N 10th St
- 216 N 12th St Unit 840
- 106 Elmwood Ave
- 310 N 7th St Unit 660
- 409 N 5th St
- 410 Drake Dr
- 121 Hillside Ave
- 202 N 7th St
- 417 N 3rd St
- 1013 N 7th St
- 920 N 4th St
- 734 E Albany Ave
- 800 Sugar Maple Dr
- 310 S 9th St
- 1412 Donahoe Dr
- 1008 N 1st St
- 505 N Pine St
- 740 N Pine St
- 64 Elmwood Ave
- 917 E Highland Ave Unit 923
- 915 E Highland Ave
- 70 Elmwood Ave
- 911 E Highland Ave
- 72 Elmwood Ave
- 65 Elmwood Ave
- 63 Elmwood Ave
- 908 Poplar Ave
- 1005 E Highland Ave
- 69 Elmwood Ave
- 904 Poplar Ave
- 900 Poplar Ave
- 78 Elmwood Ave
- 1004 Poplar Ave
- 908 E Highland Ave
- 549 N 9th St
- 1013 E Highland Ave
- 1008 Poplar Ave
- 549 N 10th St