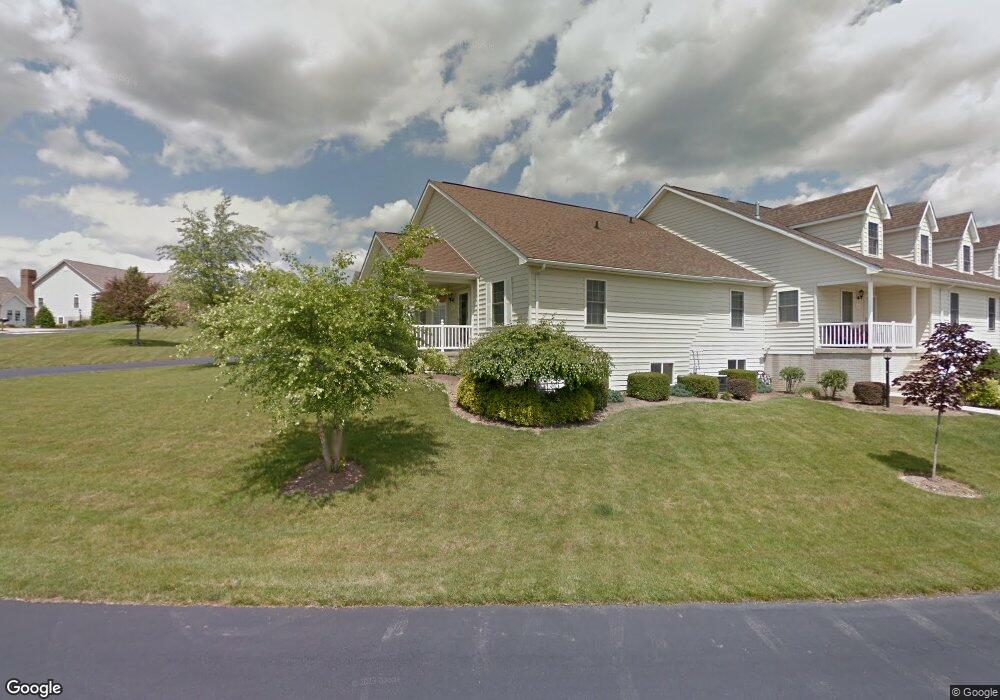
60 Fairway Dr Mount Vernon, OH 43050
Estimated Value: $249,947 - $269,000
2
Beds
3
Baths
2,000
Sq Ft
$130/Sq Ft
Est. Value
About This Home
This home is located at 60 Fairway Dr, Mount Vernon, OH 43050 and is currently estimated at $259,487, approximately $129 per square foot. 60 Fairway Dr is a home located in Knox County with nearby schools including Mount Vernon High School, St. Vincent de Paul School, and Christian Star Academy.
Ownership History
Date
Name
Owned For
Owner Type
Purchase Details
Closed on
Jun 12, 2017
Sold by
Lenkei Andrew and Lenkei Kim
Bought by
White Paula A
Current Estimated Value
Purchase Details
Closed on
Dec 23, 2010
Sold by
Lenkei Bela
Bought by
Lenkei Andrew and Lenkei Kim
Purchase Details
Closed on
May 25, 2005
Sold by
Reynolds Frank D and Reynolds Auda M
Bought by
Belker Investments Inc
Purchase Details
Closed on
Apr 18, 2002
Bought by
Reynolds Frank D and Reynolds Auda M
Create a Home Valuation Report for This Property
The Home Valuation Report is an in-depth analysis detailing your home's value as well as a comparison with similar homes in the area
Home Values in the Area
Average Home Value in this Area
Purchase History
| Date | Buyer | Sale Price | Title Company |
|---|---|---|---|
| White Paula A | $140,000 | None Available | |
| Lenkei Andrew | -- | None Available | |
| Lenkei Andrew | -- | None Available | |
| Belker Investments Inc | $109,125 | None Available | |
| Reynolds Frank D | $128,900 | -- |
Source: Public Records
Tax History Compared to Growth
Tax History
| Year | Tax Paid | Tax Assessment Tax Assessment Total Assessment is a certain percentage of the fair market value that is determined by local assessors to be the total taxable value of land and additions on the property. | Land | Improvement |
|---|---|---|---|---|
| 2024 | $2,371 | $71,280 | $5,750 | $65,530 |
| 2023 | $2,749 | $71,280 | $5,750 | $65,530 |
| 2022 | $1,851 | $52,400 | $4,220 | $48,180 |
| 2021 | $1,851 | $52,400 | $4,220 | $48,180 |
| 2020 | $1,803 | $52,400 | $4,220 | $48,180 |
| 2019 | $1,598 | $44,800 | $2,360 | $42,440 |
| 2018 | $1,984 | $44,800 | $2,360 | $42,440 |
| 2017 | $2,003 | $44,800 | $2,360 | $42,440 |
| 2016 | $1,859 | $41,480 | $2,190 | $39,290 |
| 2015 | $1,867 | $41,480 | $2,190 | $39,290 |
| 2014 | $1,877 | $41,480 | $2,190 | $39,290 |
| 2013 | $1,901 | $40,020 | $2,350 | $37,670 |
Source: Public Records
Map
Nearby Homes