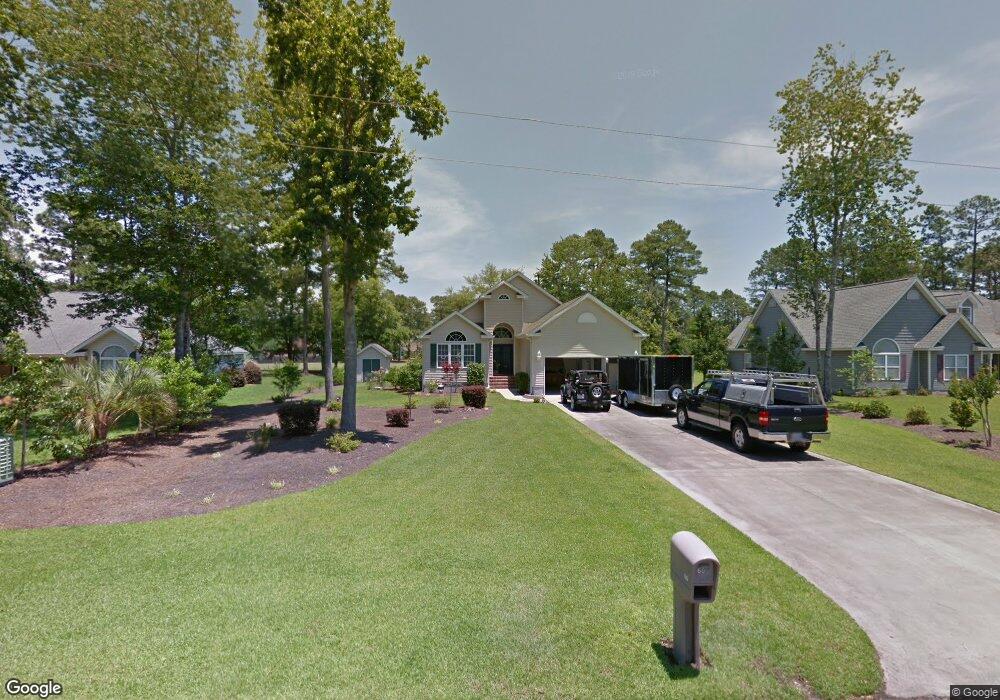
60 Fairway Dr Shallotte, NC 28470
Estimated Value: $387,010 - $447,000
3
Beds
2
Baths
1,795
Sq Ft
$235/Sq Ft
Est. Value
About This Home
This home is located at 60 Fairway Dr, Shallotte, NC 28470 and is currently estimated at $422,503, approximately $235 per square foot. 60 Fairway Dr is a home located in Brunswick County with nearby schools including Union Elementary School, Shallotte Middle School, and West Brunswick High School.
Ownership History
Date
Name
Owned For
Owner Type
Purchase Details
Closed on
May 12, 2022
Sold by
George Knab Jr Henry
Bought by
Kanb Henry George and Krusowski Mary Ann
Current Estimated Value
Purchase Details
Closed on
Nov 1, 2021
Sold by
Panza John D
Bought by
Knab Henry George and Krukowski Mary Ann
Purchase Details
Closed on
Mar 15, 2021
Sold by
Panza John D and Panza Deborah Kay
Bought by
Panza John D
Home Financials for this Owner
Home Financials are based on the most recent Mortgage that was taken out on this home.
Original Mortgage
$196,758
Interest Rate
2.7%
Mortgage Type
New Conventional
Purchase Details
Closed on
Nov 7, 2016
Sold by
Boob Ronald D and Boob Mona Dye
Bought by
Panza John D and Panza Deborah Kay
Home Financials for this Owner
Home Financials are based on the most recent Mortgage that was taken out on this home.
Original Mortgage
$206,100
Interest Rate
3.75%
Mortgage Type
Adjustable Rate Mortgage/ARM
Purchase Details
Closed on
Mar 1, 2002
Bought by
Boob Ron and Mona Dye
Create a Home Valuation Report for This Property
The Home Valuation Report is an in-depth analysis detailing your home's value as well as a comparison with similar homes in the area
Home Values in the Area
Average Home Value in this Area
Purchase History
| Date | Buyer | Sale Price | Title Company |
|---|---|---|---|
| Kanb Henry George | -- | Wortman Law Firm Pllc | |
| Knab Henry George | $330,000 | None Available | |
| Panza John D | -- | First American Mortgage Sln | |
| Panza John D | $229,000 | None Available | |
| Boob Ron | $30,000 | -- |
Source: Public Records
Mortgage History
| Date | Status | Borrower | Loan Amount |
|---|---|---|---|
| Previous Owner | Panza John D | $196,758 | |
| Previous Owner | Panza John D | $206,100 |
Source: Public Records
Tax History Compared to Growth
Tax History
| Year | Tax Paid | Tax Assessment Tax Assessment Total Assessment is a certain percentage of the fair market value that is determined by local assessors to be the total taxable value of land and additions on the property. | Land | Improvement |
|---|---|---|---|---|
| 2025 | -- | $354,280 | $40,000 | $314,280 |
| 2024 | $2,491 | $354,280 | $40,000 | $314,280 |
| 2023 | $1,854 | $354,280 | $40,000 | $314,280 |
| 2022 | $1,824 | $199,730 | $20,000 | $179,730 |
| 2021 | $1,824 | $199,730 | $20,000 | $179,730 |
| 2020 | $1,824 | $199,730 | $20,000 | $179,730 |
| 2019 | $1,824 | $22,710 | $20,000 | $2,710 |
| 2018 | $1,821 | $38,340 | $35,000 | $3,340 |
| 2017 | $1,818 | $38,340 | $35,000 | $3,340 |
| 2016 | $1,793 | $38,340 | $35,000 | $3,340 |
| 2015 | $1,793 | $202,780 | $35,000 | $167,780 |
| 2014 | $1,785 | $212,572 | $45,000 | $167,572 |
Source: Public Records
Map
Nearby Homes
- 45 Fairway Dr
- 53 Country Club Dr
- 72 Country Club Dr
- 66 Country Club Dr
- 60 Country Club Dr
- 936 Copas Rd SW
- 141 Country Club Dr Unit 79
- 28 Country Club Dr
- 484 Emerald Valley Dr
- 349 River Village
- 349 River Village Square
- 102 Country Club Villa Dr Unit 1
- 3527 Fairway Crest SW
- 3525 Fairway Crest SW
- 311 River Village Square
- 173 Country Club
- 596 River Ridge Dr Unit 2
- 488 Laurel Valley Dr
- 591 River Ridge Dr Unit 5
- 601 River Ridge Dr Unit 1
- 60 Fairway Dr Unit 20635974
- 60 Fairway Dr Unit 20657282
- 60 Fairway Dr
- 60 Fairway Dr
- 60 Fairway Dr
- 62 Fairway Dr
- 62 Fairway Dr
- 62 Fairway Crest (Lot 62)
- 58 Fairway Dr
- 0 Fairway Crest
- 56 Fairway Dr
- 64 Fairway Dr
- Lot 64 SW Fairway Crest Dr
- 64 Fairway Dr
- 64 Fairway Dr
- 47 Fairway Dr
- 47 Fairway Dr SW
- 49 Fairway Dr
- 49 Fairway Dr
- 66 Fairway Dr