60 Fox Run Rd Unit 4 Pinehurst, NC 28374
Estimated Value: $382,000 - $424,000
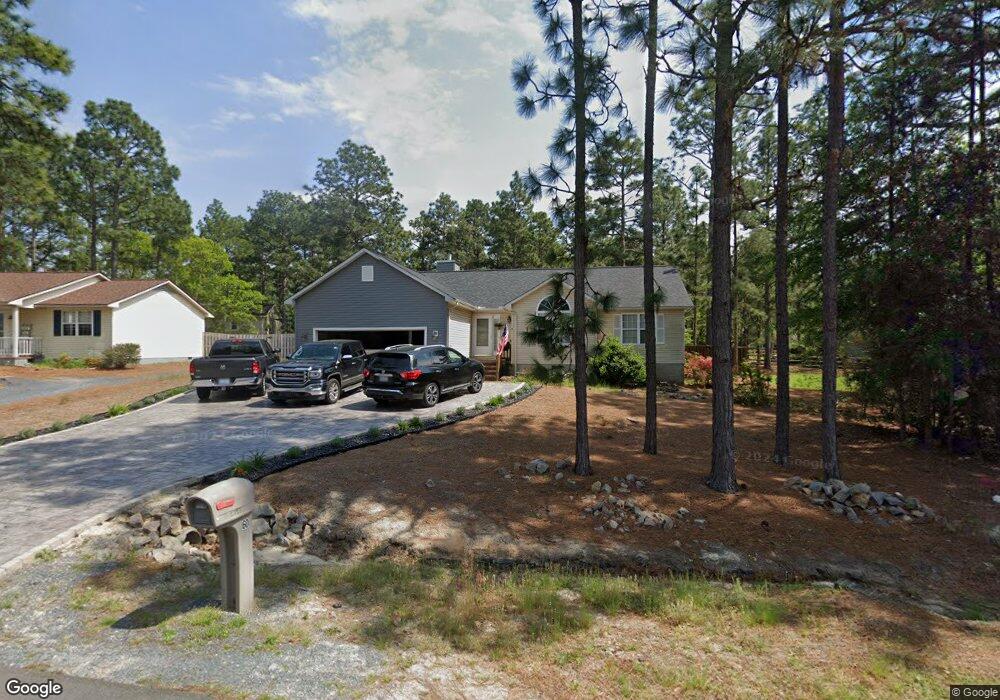
About This Home
This home is located at 60 Fox Run Rd Unit 4, Pinehurst, NC 28374 and is currently estimated at $403,991, approximately $252 per square foot. 60 Fox Run Rd Unit 4 is a home located in Moore County with nearby schools including Pinehurst Elementary School, West Pine Middle School, and Pinecrest High School.
Ownership History
We collect this data history from publicly available records. To have your information removed, we recommend requesting removal directly through your county’s website.
Purchase Details
Home Financials for this Owner
Home Financials are based on the most recent Mortgage that was taken out on this home.Purchase Details
Home Values in the Area
Average Home Value in this Area
Purchase History
We collect this data history from publicly available records. To have your information removed, we recommend requesting removal directly through your county’s website.
| Date | Buyer | Sale Price | Title Company |
|---|---|---|---|
| $164,000 | None Available | ||
| $117,000 | -- |
Mortgage History
We collect this data history from publicly available records. To have your information removed, we recommend requesting removal directly through your county’s website.
| Date | Status | Borrower | Loan Amount |
|---|---|---|---|
| Open | $161,466 |
Tax History
We collect this data history from publicly available records. To have your information removed, we recommend requesting removal directly through your county’s website.
| Year | Tax Paid | Tax Assessment Tax Assessment Total Assessment is a certain percentage of the fair market value that is determined by local assessors to be the total taxable value of land and additions on the property. | Land | Improvement |
|---|---|---|---|---|
| 2025 | $1,894 | $339,680 | $55,000 | $284,680 |
| 2024 | $1,945 | $339,680 | $55,000 | $284,680 |
| 2023 | $2,030 | $339,680 | $55,000 | $284,680 |
| 2022 | $1,772 | $212,200 | $30,000 | $182,200 |
| 2021 | $1,836 | $212,200 | $30,000 | $182,200 |
| 2020 | $1,566 | $176,310 | $30,000 | $146,310 |
| 2019 | $1,566 | $182,910 | $30,000 | $152,910 |
| 2018 | $1,402 | $175,200 | $26,500 | $148,700 |
| 2017 | $1,384 | $175,200 | $26,500 | $148,700 |
| 2015 | $1,358 | $175,200 | $26,500 | $148,700 |
| 2014 | $1,363 | $178,170 | $26,500 | $151,670 |
| 2013 | -- | $178,170 | $26,500 | $151,670 |
Map
- 60 Spring Lake Dr
- 1500 Longleaf Dr E
- 190 Fox Run Rd Unit 4
- 1755 Longleaf Dr E
- 399 Spring Lake Dr
- 301 Spring Lake Dr
- 8 Pierce Place
- 7 Calhoun Ln
- 4 Sawmill Ct Unit 15
- 11 Barkley Ln
- 2 Tyler Way Unit 9
- 5 Curtis Ln
- 365 Adams Cir
- 16 Moore Dr
- 120 Adams Cir
- 14 Minikahada Trail
- 170 Adams Cir
- 290 Adams Cir
- 2 Minikahada Trail
- 300 Gun Club Dr
Ask me questions while you tour the home.