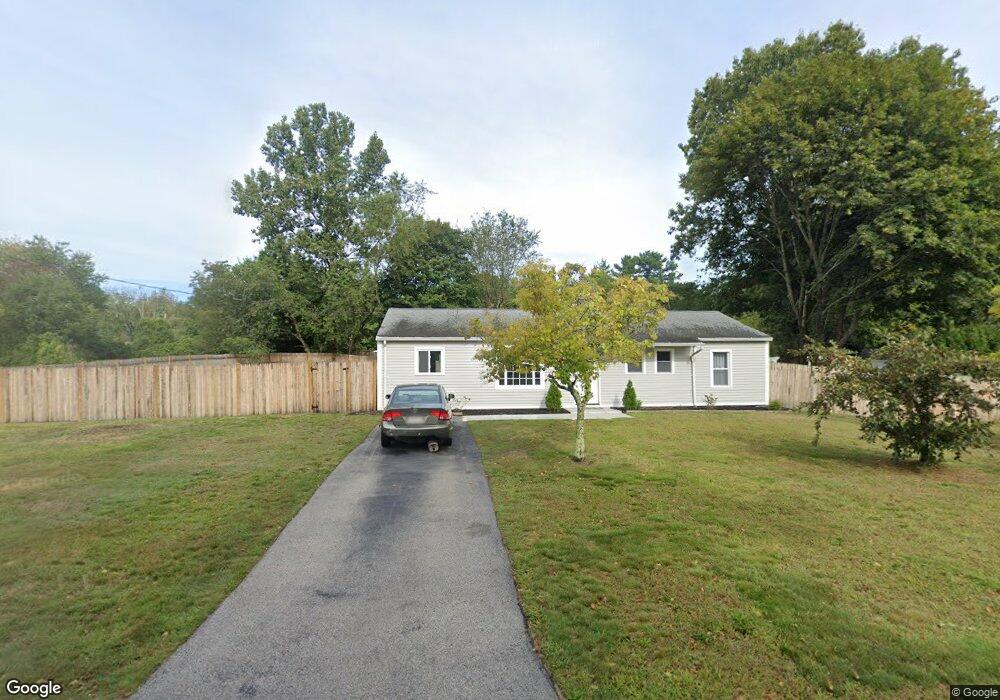
60 Franklin Rd Hanover, MA 02339
Estimated Value: $528,201 - $573,000
3
Beds
2
Baths
1,225
Sq Ft
$442/Sq Ft
Est. Value
About This Home
This home is located at 60 Franklin Rd, Hanover, MA 02339 and is currently estimated at $541,050, approximately $441 per square foot. 60 Franklin Rd is a home located in Plymouth County with nearby schools including Hanover High School and Calvary Chapel Academy.
Ownership History
Date
Name
Owned For
Owner Type
Purchase Details
Closed on
Feb 20, 2025
Sold by
Freeport Rt and Keough
Bought by
Kelly Craig and Kelly Laura
Current Estimated Value
Home Financials for this Owner
Home Financials are based on the most recent Mortgage that was taken out on this home.
Original Mortgage
$420,000
Outstanding Balance
$417,150
Interest Rate
6.93%
Mortgage Type
Purchase Money Mortgage
Estimated Equity
$123,900
Purchase Details
Closed on
Feb 21, 2024
Sold by
Buckler James R and Us Bank Tna
Bought by
Freeport Reaty T and Freeport Keough
Purchase Details
Closed on
Nov 18, 1988
Sold by
Jakielaszek Jane L
Bought by
Buckler James R
Create a Home Valuation Report for This Property
The Home Valuation Report is an in-depth analysis detailing your home's value as well as a comparison with similar homes in the area
Home Values in the Area
Average Home Value in this Area
Purchase History
| Date | Buyer | Sale Price | Title Company |
|---|---|---|---|
| Kelly Craig | $525,000 | None Available | |
| Kelly Craig | $525,000 | None Available | |
| Freeport Reaty T | $288,000 | None Available | |
| Freeport Reaty T | $288,000 | None Available | |
| Buckler James R | $128,000 | -- |
Source: Public Records
Mortgage History
| Date | Status | Borrower | Loan Amount |
|---|---|---|---|
| Open | Kelly Craig | $420,000 | |
| Closed | Kelly Craig | $420,000 | |
| Previous Owner | Buckler James R | $242,000 | |
| Previous Owner | Buckler James R | $34,500 |
Source: Public Records
Tax History
| Year | Tax Paid | Tax Assessment Tax Assessment Total Assessment is a certain percentage of the fair market value that is determined by local assessors to be the total taxable value of land and additions on the property. | Land | Improvement |
|---|---|---|---|---|
| 2025 | $3,453 | $279,600 | $210,300 | $69,300 |
| 2024 | $5,323 | $414,600 | $210,300 | $204,300 |
| 2023 | $4,840 | $358,800 | $191,300 | $167,500 |
| 2022 | $5,270 | $345,600 | $215,200 | $130,400 |
| 2021 | $4,402 | $311,700 | $184,800 | $126,900 |
| 2020 | $4,847 | $297,200 | $173,900 | $123,300 |
| 2019 | $13 | $261,100 | $152,200 | $108,900 |
| 2018 | $5,856 | $273,700 | $169,600 | $104,100 |
| 2017 | $11 | $254,500 | $158,100 | $96,400 |
| 2016 | $4,291 | $254,500 | $158,100 | $96,400 |
| 2015 | $3,918 | $242,600 | $158,100 | $84,500 |
Source: Public Records
Map
Nearby Homes
Your Personal Tour Guide
Ask me questions while you tour the home.