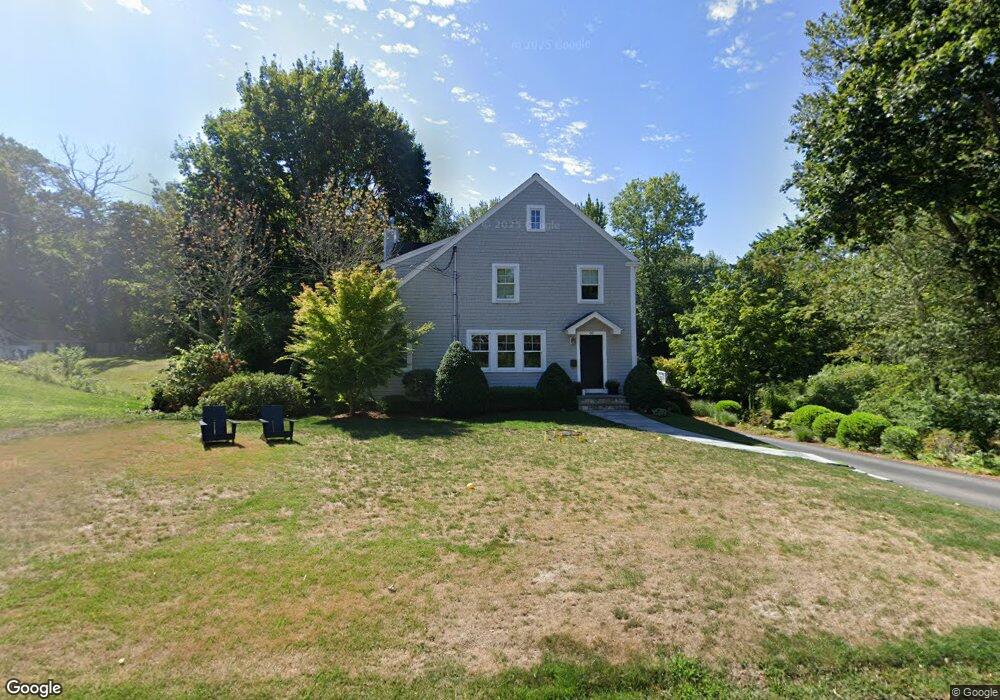
60 Garrison Rd Hingham, MA 02043
Estimated Value: $1,518,000 - $2,122,000
3
Beds
3
Baths
2,819
Sq Ft
$642/Sq Ft
Est. Value
About This Home
This home is located at 60 Garrison Rd, Hingham, MA 02043 and is currently estimated at $1,808,986, approximately $641 per square foot. 60 Garrison Rd is a home located in Plymouth County with nearby schools including East Elementary School, Hingham Middle School, and Hingham High School.
Ownership History
Date
Name
Owned For
Owner Type
Purchase Details
Closed on
Aug 28, 2015
Sold by
Riddell Peter S and Riddell Joelle A
Bought by
Dennis Scott and Dennis Kate
Current Estimated Value
Home Financials for this Owner
Home Financials are based on the most recent Mortgage that was taken out on this home.
Original Mortgage
$709,600
Outstanding Balance
$557,714
Interest Rate
4.09%
Mortgage Type
Purchase Money Mortgage
Estimated Equity
$1,251,272
Purchase Details
Closed on
Mar 16, 2001
Sold by
Int Lenihan Hertberg and Lenihan Brian P
Bought by
Riddell Peter S and Riddell Joelle A
Purchase Details
Closed on
Sep 29, 1995
Sold by
Levin Adam L and Nathanson Gail E
Bought by
Lenihan Brian and Hertberg Bonnie
Create a Home Valuation Report for This Property
The Home Valuation Report is an in-depth analysis detailing your home's value as well as a comparison with similar homes in the area
Purchase History
| Date | Buyer | Sale Price | Title Company |
|---|---|---|---|
| Dennis Scott | $1,004,500 | -- | |
| Riddell Peter S | $485,000 | -- | |
| Lenihan Brian | $271,000 | -- |
Source: Public Records
Mortgage History
| Date | Status | Borrower | Loan Amount |
|---|---|---|---|
| Open | Dennis Scott | $709,600 | |
| Previous Owner | Lenihan Brian | $302,000 | |
| Previous Owner | Lenihan Brian | $310,000 |
Source: Public Records
Tax History
| Year | Tax Paid | Tax Assessment Tax Assessment Total Assessment is a certain percentage of the fair market value that is determined by local assessors to be the total taxable value of land and additions on the property. | Land | Improvement |
|---|---|---|---|---|
| 2025 | $15,922 | $1,489,400 | $762,200 | $727,200 |
| 2024 | $15,480 | $1,426,700 | $762,200 | $664,500 |
| 2023 | $13,676 | $1,367,600 | $762,200 | $605,400 |
| 2022 | $13,597 | $1,176,200 | $692,900 | $483,300 |
| 2021 | $13,067 | $1,107,400 | $654,400 | $453,000 |
| 2020 | $12,038 | $1,044,100 | $577,400 | $466,700 |
| 2019 | $11,982 | $1,014,600 | $577,400 | $437,200 |
| 2018 | $11,942 | $1,014,600 | $577,400 | $437,200 |
| 2017 | $11,526 | $940,900 | $559,100 | $381,800 |
| 2016 | $9,616 | $769,900 | $443,800 | $326,100 |
| 2015 | $9,382 | $748,800 | $422,700 | $326,100 |
Source: Public Records
Map
Nearby Homes
Your Personal Tour Guide
Ask me questions while you tour the home.