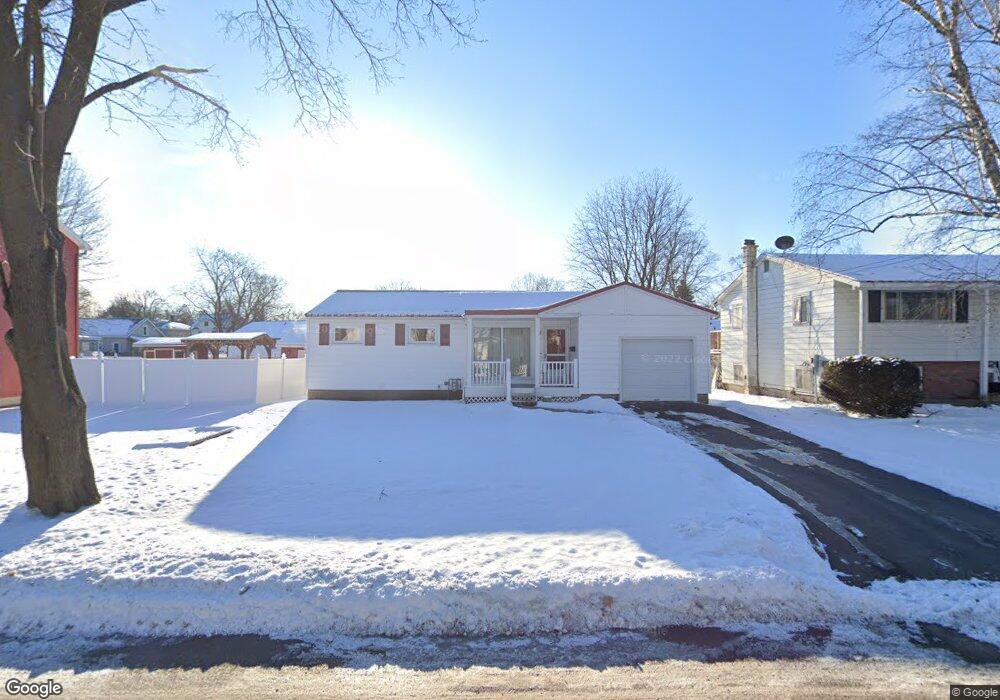
60 Grove Ave Glens Falls, NY 12801
Estimated Value: $243,000 - $258,000
3
Beds
1
Bath
950
Sq Ft
$263/Sq Ft
Est. Value
About This Home
This home is located at 60 Grove Ave, Glens Falls, NY 12801 and is currently estimated at $250,062, approximately $263 per square foot. 60 Grove Ave is a home located in Warren County with nearby schools including Glens Falls Senior High School and St. Mary-St. Alphonsus Catholic School.
Ownership History
Date
Name
Owned For
Owner Type
Purchase Details
Closed on
Feb 28, 2023
Sold by
Monroe John F and Clodgo Diane M
Bought by
Neal Michele L
Current Estimated Value
Home Financials for this Owner
Home Financials are based on the most recent Mortgage that was taken out on this home.
Original Mortgage
$179,000
Outstanding Balance
$173,401
Interest Rate
6.15%
Mortgage Type
Purchase Money Mortgage
Estimated Equity
$76,661
Purchase Details
Closed on
Jan 30, 2004
Sold by
Monroe John
Bought by
Monroe Life Estate John & Jeannine
Create a Home Valuation Report for This Property
The Home Valuation Report is an in-depth analysis detailing your home's value as well as a comparison with similar homes in the area
Home Values in the Area
Average Home Value in this Area
Purchase History
| Date | Buyer | Sale Price | Title Company |
|---|---|---|---|
| Neal Michele L | $200,000 | None Available | |
| Monroe Life Estate John & Jeannine | -- | -- |
Source: Public Records
Mortgage History
| Date | Status | Borrower | Loan Amount |
|---|---|---|---|
| Open | Neal Michele L | $179,000 |
Source: Public Records
Tax History Compared to Growth
Tax History
| Year | Tax Paid | Tax Assessment Tax Assessment Total Assessment is a certain percentage of the fair market value that is determined by local assessors to be the total taxable value of land and additions on the property. | Land | Improvement |
|---|---|---|---|---|
| 2024 | $4,512 | $162,600 | $22,000 | $140,600 |
| 2023 | $4,435 | $154,900 | $22,000 | $132,900 |
| 2022 | $3,071 | $154,900 | $22,000 | $132,900 |
| 2021 | $3,184 | $103,700 | $16,300 | $87,400 |
| 2020 | $3,164 | $103,700 | $16,300 | $87,400 |
| 2019 | $1,344 | $103,700 | $16,300 | $87,400 |
| 2018 | $1,344 | $103,700 | $16,300 | $87,400 |
| 2017 | $1,336 | $103,700 | $16,300 | $87,400 |
| 2016 | $2,984 | $103,700 | $16,300 | $87,400 |
| 2015 | -- | $103,700 | $16,300 | $87,400 |
| 2014 | -- | $103,700 | $16,300 | $87,400 |
Source: Public Records
Map
Nearby Homes