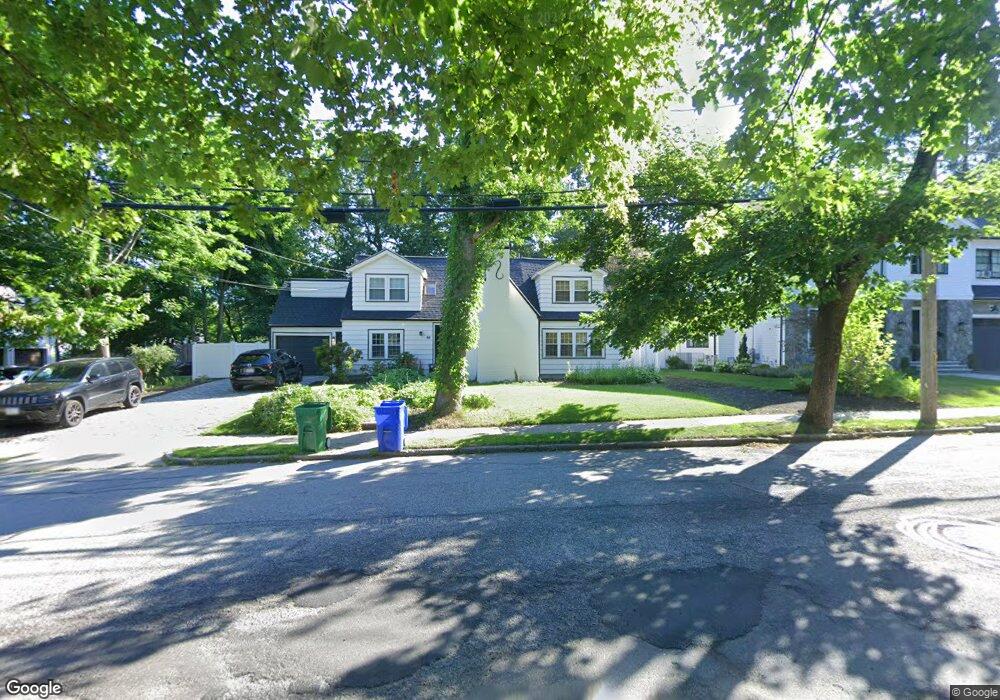
60 Hartman Rd Newton Center, MA 02459
Oak Hill NeighborhoodEstimated Value: $1,812,000 - $1,979,000
4
Beds
5
Baths
2,417
Sq Ft
$776/Sq Ft
Est. Value
About This Home
This home is located at 60 Hartman Rd, Newton Center, MA 02459 and is currently estimated at $1,875,307, approximately $775 per square foot. 60 Hartman Rd is a home located in Middlesex County with nearby schools including Memorial Spaulding Elementary School, Charles E Brown Middle School, and Oak Hill Middle School.
Ownership History
Date
Name
Owned For
Owner Type
Purchase Details
Closed on
Apr 17, 2025
Sold by
Farmer Stephen R
Bought by
Stephen R Farmer Lt and Farmer
Current Estimated Value
Purchase Details
Closed on
Aug 23, 1996
Sold by
Hahn Anna J
Bought by
Farmer Stephen R and Farmer Carol A
Home Financials for this Owner
Home Financials are based on the most recent Mortgage that was taken out on this home.
Original Mortgage
$323,100
Interest Rate
8.4%
Mortgage Type
Purchase Money Mortgage
Create a Home Valuation Report for This Property
The Home Valuation Report is an in-depth analysis detailing your home's value as well as a comparison with similar homes in the area
Home Values in the Area
Average Home Value in this Area
Purchase History
| Date | Buyer | Sale Price | Title Company |
|---|---|---|---|
| Stephen R Farmer Lt | -- | None Available | |
| Stephen R Farmer Lt | -- | None Available | |
| Farmer Stephen R | $359,000 | -- |
Source: Public Records
Mortgage History
| Date | Status | Borrower | Loan Amount |
|---|---|---|---|
| Previous Owner | Farmer Stephen R | $450,000 | |
| Previous Owner | Farmer Stephen R | $364,000 | |
| Previous Owner | Farmer Stephen R | $25,000 | |
| Previous Owner | Farmer Stephen R | $323,100 |
Source: Public Records
Tax History Compared to Growth
Tax History
| Year | Tax Paid | Tax Assessment Tax Assessment Total Assessment is a certain percentage of the fair market value that is determined by local assessors to be the total taxable value of land and additions on the property. | Land | Improvement |
|---|---|---|---|---|
| 2025 | $15,174 | $1,548,400 | $1,117,700 | $430,700 |
| 2024 | $14,672 | $1,503,300 | $1,085,100 | $418,200 |
| 2023 | $13,138 | $1,290,600 | $838,200 | $452,400 |
| 2022 | $12,571 | $1,195,000 | $776,100 | $418,900 |
| 2021 | $12,131 | $1,127,400 | $732,200 | $395,200 |
| 2020 | $11,770 | $1,127,400 | $732,200 | $395,200 |
| 2019 | $11,439 | $1,094,600 | $710,900 | $383,700 |
| 2018 | $10,971 | $1,014,000 | $646,500 | $367,500 |
| 2017 | $10,637 | $956,600 | $609,900 | $346,700 |
| 2016 | $10,174 | $894,000 | $570,000 | $324,000 |
| 2015 | $9,700 | $835,500 | $532,700 | $302,800 |
Source: Public Records
Map
Nearby Homes