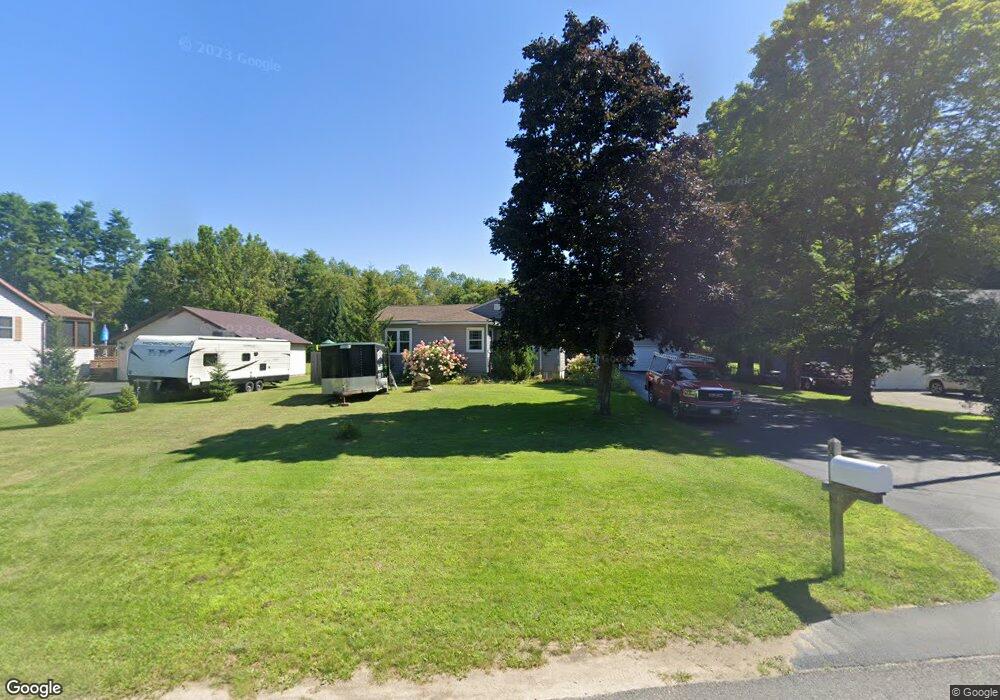
60 Haynes Rd Plattsburgh, NY 12901
Estimated Value: $198,011 - $228,000
3
Beds
1
Bath
1,311
Sq Ft
$162/Sq Ft
Est. Value
About This Home
This home is located at 60 Haynes Rd, Plattsburgh, NY 12901 and is currently estimated at $212,753, approximately $162 per square foot. 60 Haynes Rd is a home located in Clinton County with nearby schools including Beekmantown Elementary School, Beekmantown Middle School, and Beekmantown High School.
Ownership History
Date
Name
Owned For
Owner Type
Purchase Details
Closed on
Jan 17, 2008
Sold by
Pellerin Gerald
Bought by
Chotkowski Patricia
Current Estimated Value
Home Financials for this Owner
Home Financials are based on the most recent Mortgage that was taken out on this home.
Original Mortgage
$85,000
Interest Rate
6.02%
Mortgage Type
Purchase Money Mortgage
Purchase Details
Closed on
Oct 19, 2000
Sold by
Shambo Mary Ellen
Bought by
Pellerin Gerald E
Create a Home Valuation Report for This Property
The Home Valuation Report is an in-depth analysis detailing your home's value as well as a comparison with similar homes in the area
Home Values in the Area
Average Home Value in this Area
Purchase History
| Date | Buyer | Sale Price | Title Company |
|---|---|---|---|
| Chotkowski Patricia | $112,500 | Matthew Favro | |
| Pellerin Gerald E | $65,000 | John T Snell |
Source: Public Records
Mortgage History
| Date | Status | Borrower | Loan Amount |
|---|---|---|---|
| Closed | Chotkowski Patricia | $85,000 |
Source: Public Records
Tax History Compared to Growth
Tax History
| Year | Tax Paid | Tax Assessment Tax Assessment Total Assessment is a certain percentage of the fair market value that is determined by local assessors to be the total taxable value of land and additions on the property. | Land | Improvement |
|---|---|---|---|---|
| 2024 | $2,499 | $126,500 | $54,100 | $72,400 |
| 2023 | $2,571 | $126,500 | $54,100 | $72,400 |
| 2022 | $3,105 | $126,500 | $34,300 | $92,200 |
| 2021 | $3,166 | $126,500 | $30,300 | $96,200 |
| 2020 | $2,341 | $116,500 | $30,300 | $86,200 |
| 2019 | $2,522 | $116,500 | $28,700 | $87,800 |
| 2018 | $2,522 | $116,500 | $28,700 | $87,800 |
| 2017 | $2,765 | $126,500 | $28,700 | $97,800 |
| 2016 | $2,742 | $126,500 | $28,700 | $97,800 |
| 2015 | -- | $126,500 | $28,700 | $97,800 |
| 2014 | -- | $126,500 | $23,100 | $103,400 |
Source: Public Records
Map
Nearby Homes