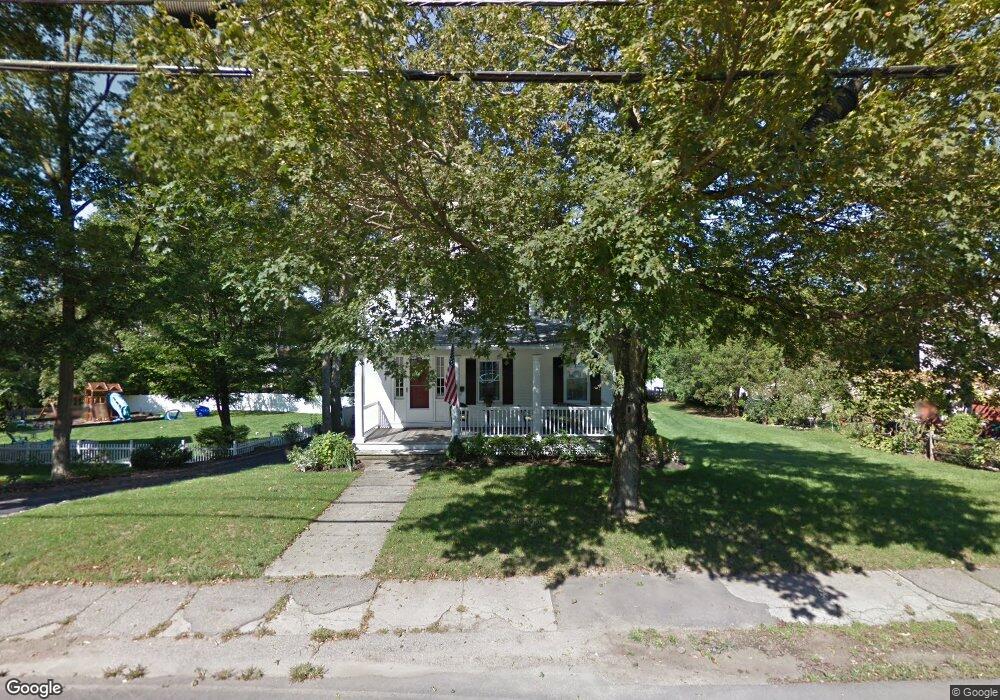
60 High St Needham Heights, MA 02494
Estimated Value: $998,000 - $1,314,000
3
Beds
2
Baths
879
Sq Ft
$1,357/Sq Ft
Est. Value
About This Home
This home is located at 60 High St, Needham Heights, MA 02494 and is currently estimated at $1,192,501, approximately $1,356 per square foot. 60 High St is a home located in Norfolk County with nearby schools including Eliot Elementary School, High Rock Middle School, and Pollard Middle School.
Ownership History
Date
Name
Owned For
Owner Type
Purchase Details
Closed on
Dec 29, 2021
Sold by
A A Scannell T 2011 and Scannell
Bought by
A A Scannell T 2011 and Scannell
Current Estimated Value
Purchase Details
Closed on
Aug 7, 2019
Sold by
Scannell Agnes A and Scannell
Bought by
Agnes A Scannell T 2011 and Scannell
Home Financials for this Owner
Home Financials are based on the most recent Mortgage that was taken out on this home.
Original Mortgage
$215,000
Interest Rate
3.7%
Mortgage Type
New Conventional
Purchase Details
Closed on
Jun 14, 2011
Sold by
Scannell Agnes A
Bought by
2011 Agnes A Scannell and 2011 Scannell
Create a Home Valuation Report for This Property
The Home Valuation Report is an in-depth analysis detailing your home's value as well as a comparison with similar homes in the area
Home Values in the Area
Average Home Value in this Area
Purchase History
| Date | Buyer | Sale Price | Title Company |
|---|---|---|---|
| A A Scannell T 2011 | -- | None Available | |
| A A Scannell T 2011 | -- | None Available | |
| Agnes A Scannell T 2011 | -- | -- | |
| Agnes A Scannell T 2011 | -- | -- | |
| Agnes A Scannell T 2011 | -- | -- | |
| Scannell Agnes A | -- | -- | |
| 2011 Agnes A Scannell | -- | -- | |
| 2011 Agnes A Scannell | -- | -- | |
| 2011 Agnes A Scannell | -- | -- |
Source: Public Records
Mortgage History
| Date | Status | Borrower | Loan Amount |
|---|---|---|---|
| Previous Owner | Agnes A Scannell T 2011 | $215,000 | |
| Previous Owner | 2011 Agnes A Scannell | $150,000 |
Source: Public Records
Tax History
| Year | Tax Paid | Tax Assessment Tax Assessment Total Assessment is a certain percentage of the fair market value that is determined by local assessors to be the total taxable value of land and additions on the property. | Land | Improvement |
|---|---|---|---|---|
| 2025 | $10,642 | $1,004,000 | $785,600 | $218,400 |
| 2024 | $9,863 | $787,800 | $561,000 | $226,800 |
| 2023 | $10,050 | $770,700 | $561,000 | $209,700 |
| 2022 | $9,287 | $694,600 | $493,200 | $201,400 |
| 2021 | $9,051 | $694,600 | $493,200 | $201,400 |
| 2020 | $8,461 | $677,400 | $493,200 | $184,200 |
| 2019 | $7,791 | $628,800 | $449,200 | $179,600 |
| 2018 | $7,470 | $628,800 | $449,200 | $179,600 |
| 2017 | $7,249 | $609,700 | $449,200 | $160,500 |
| 2016 | $7,036 | $609,700 | $449,200 | $160,500 |
| 2015 | $6,884 | $609,700 | $449,200 | $160,500 |
| 2014 | $6,524 | $560,500 | $409,200 | $151,300 |
Source: Public Records
Map
Nearby Homes
- 40 High St
- 28 Mercer Rd
- 7 West St
- 100 Woodbine Cir
- 108 Woodbine Cir
- 510 Webster St
- 5 Hazel Ln
- 132 Hillside Ave
- 134 Hillside Ave Unit 134
- 143 Hunting Rd
- 58 Morton St
- 140 Hillside Ave
- 140 Hillside Ave Unit a
- 5 Sachem Rd
- 379 Hunnewell St Unit 379
- 385 Hillside Ave
- 385 Hillside Ave Unit 385
- 3 Crescent Rd
- 17 Lindbergh Ave
- 447 Hillside Ave
Your Personal Tour Guide
Ask me questions while you tour the home.