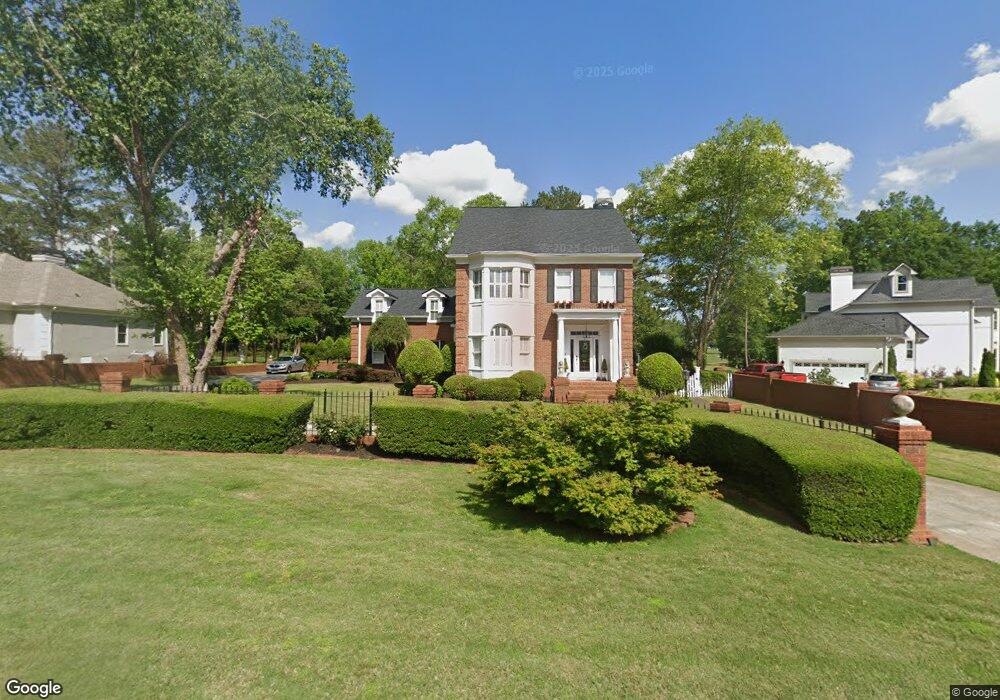
60 Highlands Point Unit 5 Newnan, GA 30265
White Oak NeighborhoodEstimated Value: $578,000 - $851,000
4
Beds
5
Baths
4,638
Sq Ft
$144/Sq Ft
Est. Value
About This Home
This home is located at 60 Highlands Point Unit 5, Newnan, GA 30265 and is currently estimated at $666,558, approximately $143 per square foot. 60 Highlands Point Unit 5 is a home located in Coweta County with nearby schools including White Oak Elementary School, Arnall Middle School, and East Coweta High School.
Ownership History
Date
Name
Owned For
Owner Type
Purchase Details
Closed on
May 11, 2016
Sold by
Galvin Elizabeth A
Bought by
Williams Cbarles and Williams Kirsten
Current Estimated Value
Home Financials for this Owner
Home Financials are based on the most recent Mortgage that was taken out on this home.
Original Mortgage
$319,920
Outstanding Balance
$254,013
Interest Rate
3.58%
Mortgage Type
New Conventional
Estimated Equity
$412,545
Purchase Details
Closed on
Jun 9, 2006
Sold by
Galvin John R and Galvin Eliz
Bought by
Galvin Elizabeth A
Purchase Details
Closed on
Aug 27, 1996
Sold by
Dutton Harvey Dianne
Bought by
Glavin John Elizabeth
Purchase Details
Closed on
Oct 12, 1987
Bought by
Dutton Harvey and Dutton Dian
Purchase Details
Closed on
Sep 30, 1987
Bought by
Dutton Harvey and Dutton Dian
Create a Home Valuation Report for This Property
The Home Valuation Report is an in-depth analysis detailing your home's value as well as a comparison with similar homes in the area
Home Values in the Area
Average Home Value in this Area
Purchase History
| Date | Buyer | Sale Price | Title Company |
|---|---|---|---|
| Williams Cbarles | $399,900 | -- | |
| Galvin Elizabeth A | -- | -- | |
| Glavin John Elizabeth | $383,000 | -- | |
| Dutton Harvey | -- | -- | |
| Dutton Harvey | $39,900 | -- |
Source: Public Records
Mortgage History
| Date | Status | Borrower | Loan Amount |
|---|---|---|---|
| Open | Williams Cbarles | $319,920 | |
| Closed | Glavin John Elizabeth | $0 |
Source: Public Records
Tax History Compared to Growth
Tax History
| Year | Tax Paid | Tax Assessment Tax Assessment Total Assessment is a certain percentage of the fair market value that is determined by local assessors to be the total taxable value of land and additions on the property. | Land | Improvement |
|---|---|---|---|---|
| 2024 | $5,138 | $221,321 | $36,000 | $185,321 |
| 2023 | $5,138 | $200,898 | $36,000 | $164,898 |
| 2022 | $4,751 | $192,863 | $36,000 | $156,863 |
| 2021 | $4,689 | $178,114 | $20,000 | $158,114 |
| 2020 | $4,350 | $193,116 | $20,000 | $173,116 |
| 2019 | $4,485 | $153,221 | $34,000 | $119,221 |
| 2018 | $4,492 | $153,221 | $34,000 | $119,221 |
| 2017 | $4,491 | $153,221 | $34,000 | $119,221 |
| 2016 | $4,437 | $153,221 | $34,000 | $119,221 |
| 2015 | $4,106 | $144,221 | $25,000 | $119,221 |
| 2014 | $4,073 | $144,221 | $25,000 | $119,221 |
Source: Public Records
Map
Nearby Homes
- 50 Torrey Pines Ct
- 35 Torrey Pines Ct
- 148 White Oak Dr
- 125 Torrey Pines Ct
- 50 Inverness Way
- 30 Village Ln
- 431 White Oak Dr
- 25 Fawn Ridge
- 10 Buckthorne Dr
- 22 Barberry Dr
- 7 Paw Ln
- 63 Clubview Dr
- 34 Preswick Park Dr
- 5 Buckthorne Dr
- 90 Courtyard Ln
- 6 Leverett Dr Unit 17
- 280 Northcrest Dr
- 45 Burwick Ct Unit 13
- 6 Windsong Dr
- 100 Georgian Oaks Ct
- 60 Highlands Point
- 50 Highlands Point
- 70 Highlands Point Unit 1
- 70 Highlands Point
- 5 Kilburn Place
- 40 Highlands Point
- 45 Highlands Point
- 75 Highlands Point
- 0 Kilburn Place Unit 8353063
- 35 Highlands Point
- 30 Highlands Point
- 21 Kilburn Place
- 85 Highlands Point
- 20 Highlands Point
- 10 Muirfield Ct
- 11 Overlook Dr
- 50 Torrey Pines Ct Unit 126
- 4 Torrey Pines Ct
- 165 Torrey Pines Ct
- 60 Torrey Pines Ct