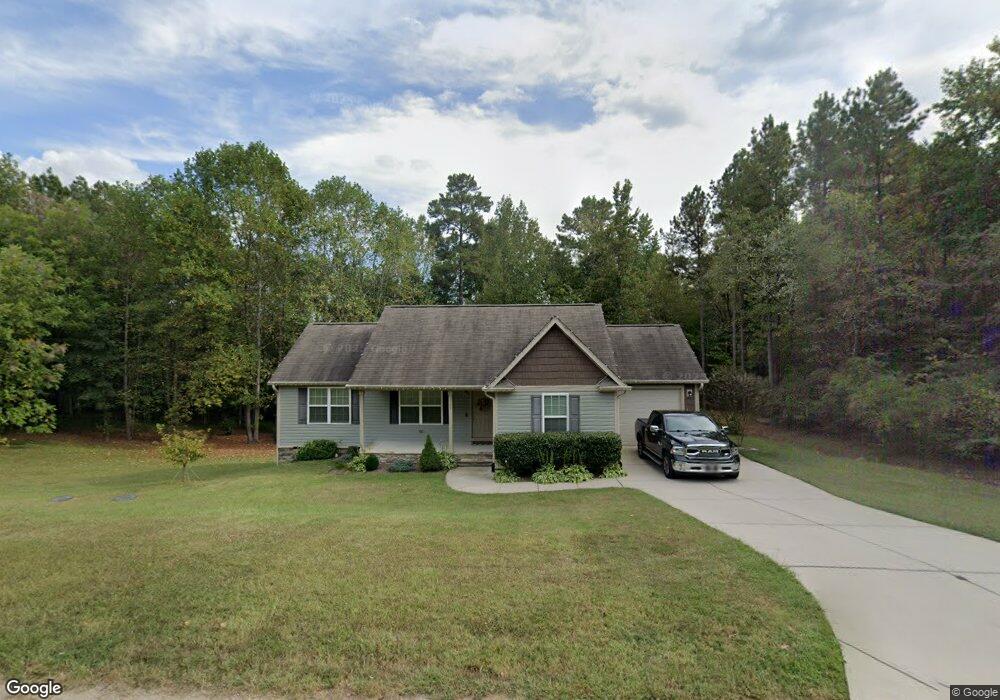
60 Hillside Village Dr Louisburg, NC 27549
Estimated Value: $279,000 - $308,000
3
Beds
2
Baths
1,276
Sq Ft
$233/Sq Ft
Est. Value
About This Home
This home is located at 60 Hillside Village Dr, Louisburg, NC 27549 and is currently estimated at $296,896, approximately $232 per square foot. 60 Hillside Village Dr is a home located in Franklin County with nearby schools including Louisburg Elementary School, Terrell Lane Middle School, and Louisburg High School.
Ownership History
Date
Name
Owned For
Owner Type
Purchase Details
Closed on
Dec 31, 2019
Sold by
Barbour Steven D and Young Barbour Allison
Bought by
Herron Wesley and Londres Michele
Current Estimated Value
Home Financials for this Owner
Home Financials are based on the most recent Mortgage that was taken out on this home.
Original Mortgage
$190,000
Outstanding Balance
$167,151
Interest Rate
3.6%
Mortgage Type
VA
Estimated Equity
$129,745
Purchase Details
Closed on
Jul 24, 2017
Sold by
Davson Custom Homes Company
Bought by
Barbour Steven D and Young Barbour Allison
Home Financials for this Owner
Home Financials are based on the most recent Mortgage that was taken out on this home.
Original Mortgage
$131,200
Interest Rate
3.91%
Mortgage Type
New Conventional
Purchase Details
Closed on
Nov 14, 2016
Sold by
D & D Home Builders Inc
Bought by
Davson Custom Homes Company
Purchase Details
Closed on
Sep 16, 2016
Sold by
Jl Development Custom Homes Llc
Bought by
D & D Home Builders Inc
Create a Home Valuation Report for This Property
The Home Valuation Report is an in-depth analysis detailing your home's value as well as a comparison with similar homes in the area
Home Values in the Area
Average Home Value in this Area
Purchase History
| Date | Buyer | Sale Price | Title Company |
|---|---|---|---|
| Herron Wesley | $190,000 | None Available | |
| Barbour Steven D | $164,000 | Attorney | |
| Davson Custom Homes Company | $12,000 | Attorney | |
| D & D Home Builders Inc | $35,000 | Attorney |
Source: Public Records
Mortgage History
| Date | Status | Borrower | Loan Amount |
|---|---|---|---|
| Open | Herron Wesley | $190,000 | |
| Previous Owner | Barbour Steven D | $131,200 |
Source: Public Records
Tax History Compared to Growth
Tax History
| Year | Tax Paid | Tax Assessment Tax Assessment Total Assessment is a certain percentage of the fair market value that is determined by local assessors to be the total taxable value of land and additions on the property. | Land | Improvement |
|---|---|---|---|---|
| 2025 | $1,708 | $265,210 | $62,400 | $202,810 |
| 2024 | $1,708 | $265,210 | $62,400 | $202,810 |
| 2023 | $1,600 | $168,850 | $25,000 | $143,850 |
| 2022 | $1,590 | $168,850 | $25,000 | $143,850 |
| 2021 | $1,607 | $168,850 | $25,000 | $143,850 |
| 2020 | $1,599 | $168,850 | $25,000 | $143,850 |
| 2019 | $1,585 | $168,850 | $25,000 | $143,850 |
| 2018 | $1,584 | $168,850 | $25,000 | $143,850 |
| 2017 | $244 | $25,000 | $25,000 | $0 |
| 2016 | $253 | $25,000 | $25,000 | $0 |
| 2015 | $252 | $25,000 | $25,000 | $0 |
| 2014 | -- | $25,000 | $25,000 | $0 |
Source: Public Records
Map
Nearby Homes
- 65 Hillside Village Dr
- 25 Hillside Village Dr
- 705 Timberlake Rd
- 20 Lemon Drop Ln
- 30 Lemon Drop Ln
- 30 Watermelon Dr
- 35 Watermelon Dr
- 25 Watermelon Dr
- 1213 U S 401
- 61.9 Acres Timberlake Rd
- 5.3 Acres Timberlake Rd
- 14 Acres Timberlake Rd
- 38 Acres Timberlake Rd
- 1.8 Acres Timberlake Rd
- 190 Whistlers Cove
- 225 Whistlers Cove
- 255 Whistlers Cove
- 38 Acres Timberlake Rd
- 14 Acres Timberlake Rd
- 5.25 Acres Timberlake Rd
- 55 Hillside Village Dr
- 40 Hillside Village Dr
- 80 Hillside Village Dr
- 45 Hillside Village Dr
- 75 Hillside Village Dr
- none Hillside Village Dr
- Lot 4 & 5 Hillside Village Dr
- P Hillside Village Dr
- Lot 15 Hillside Village Dr
- Lot 13 Hillside Village Dr
- Lot 16 Hillside Village Dr
- Lot 7 Hillside Village Dr
- Lot 6 Hillside Village Dr
- Lot 32 Hillside Village Dr
- Lot 5 Hillside Village Dr
- Lot 14 Hillside Village Dr
- Lot 17 Hillside Village Dr
- Lot 34 Hillside Village Dr
- Lot 4 Hillside Village Dr
- Lot 26 Hillside Village Dr