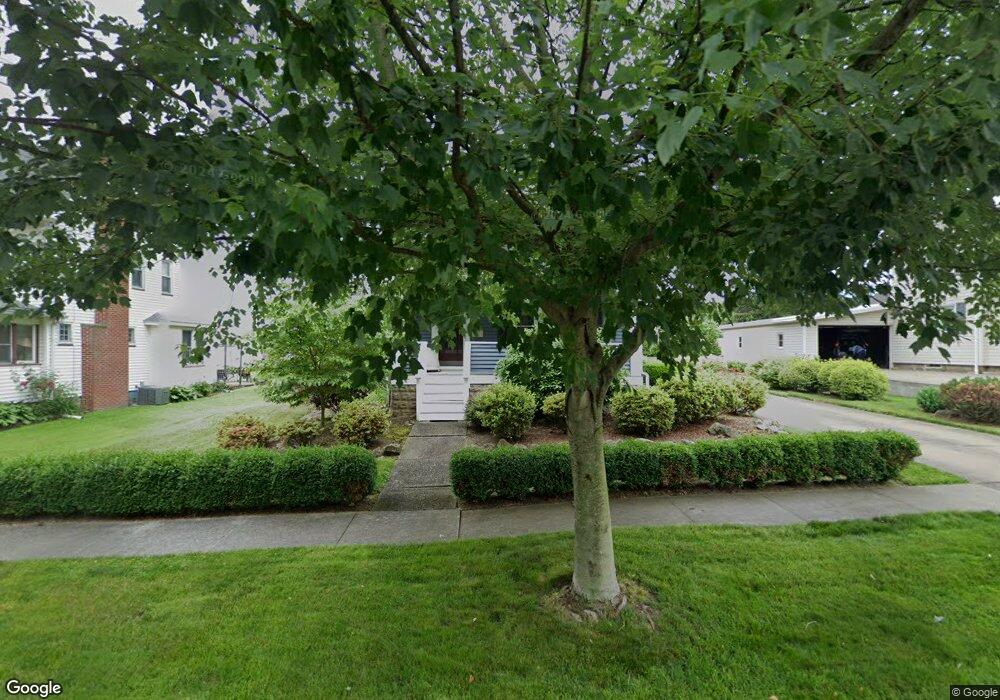
60 Howard St Doylestown, OH 44230
Estimated Value: $190,768 - $245,000
4
Beds
1
Bath
1,489
Sq Ft
$148/Sq Ft
Est. Value
About This Home
This home is located at 60 Howard St, Doylestown, OH 44230 and is currently estimated at $220,942, approximately $148 per square foot. 60 Howard St is a home located in Wayne County with nearby schools including Hazel Harvey Elementary School, Chippewa Intermediate School, and Chippewa Jr./Sr. High School.
Ownership History
Date
Name
Owned For
Owner Type
Purchase Details
Closed on
Jul 15, 2011
Sold by
Bailes Christopher A and Bailes Debra L
Bought by
Radanof David A
Current Estimated Value
Home Financials for this Owner
Home Financials are based on the most recent Mortgage that was taken out on this home.
Original Mortgage
$107,200
Outstanding Balance
$69,664
Interest Rate
3.37%
Mortgage Type
Adjustable Rate Mortgage/ARM
Estimated Equity
$151,278
Purchase Details
Closed on
Jul 10, 2003
Sold by
Lepley Todd M
Bought by
Bailes Christopher A
Home Financials for this Owner
Home Financials are based on the most recent Mortgage that was taken out on this home.
Original Mortgage
$85,600
Interest Rate
5.36%
Mortgage Type
Unknown
Purchase Details
Closed on
Jan 19, 2001
Sold by
Snyder Curtis D
Bought by
Lepley Todd M
Home Financials for this Owner
Home Financials are based on the most recent Mortgage that was taken out on this home.
Original Mortgage
$70,400
Interest Rate
7.58%
Mortgage Type
New Conventional
Create a Home Valuation Report for This Property
The Home Valuation Report is an in-depth analysis detailing your home's value as well as a comparison with similar homes in the area
Home Values in the Area
Average Home Value in this Area
Purchase History
| Date | Buyer | Sale Price | Title Company |
|---|---|---|---|
| Radanof David A | $134,000 | Kingdom Title Solutions Inc | |
| Bailes Christopher A | $107,000 | Real Living Title Agency Ltd | |
| Lepley Todd M | $88,000 | -- |
Source: Public Records
Mortgage History
| Date | Status | Borrower | Loan Amount |
|---|---|---|---|
| Open | Radanof David A | $107,200 | |
| Previous Owner | Bailes Christopher A | $85,600 | |
| Previous Owner | Lepley Todd M | $70,400 |
Source: Public Records
Tax History
| Year | Tax Paid | Tax Assessment Tax Assessment Total Assessment is a certain percentage of the fair market value that is determined by local assessors to be the total taxable value of land and additions on the property. | Land | Improvement |
|---|---|---|---|---|
| 2024 | $1,948 | $53,130 | $13,280 | $39,850 |
| 2023 | $1,957 | $53,540 | $13,280 | $40,260 |
| 2022 | $1,686 | $41,830 | $10,380 | $31,450 |
| 2021 | $1,697 | $41,830 | $10,380 | $31,450 |
| 2020 | $1,709 | $41,830 | $10,380 | $31,450 |
| 2019 | $1,863 | $43,970 | $14,390 | $29,580 |
| 2018 | $1,880 | $43,970 | $14,390 | $29,580 |
| 2017 | $1,865 | $43,970 | $14,390 | $29,580 |
| 2016 | $1,821 | $42,280 | $13,840 | $28,440 |
| 2015 | $1,813 | $42,280 | $13,840 | $28,440 |
| 2014 | $1,606 | $42,280 | $13,840 | $28,440 |
| 2013 | $1,456 | $37,210 | $14,300 | $22,910 |
Source: Public Records
Map
Nearby Homes
- 288 E Clinton St
- 497 Gates St
- 680 Thorn Way
- 620 Thorn Way
- 580 Thorn Way
- 0 Akron Rd Unit 5123781
- 500 W Clinton St
- 0 S Portage St
- VL 1067 Homan Dr
- 233 Homan Dr
- 15500 Freedom Dr
- V/L 1050 Melanie Ln
- V/L approx 67.56ac Gates St
- 325 Catawba Path
- 46 Hidden Pond Dr
- 100 Merlot Ct
- 15899 Mccallum Dr
- 12249 Whitman Rd
- 442 Madison Trail
- 12045 Coal Bank Rd
Your Personal Tour Guide
Ask me questions while you tour the home.