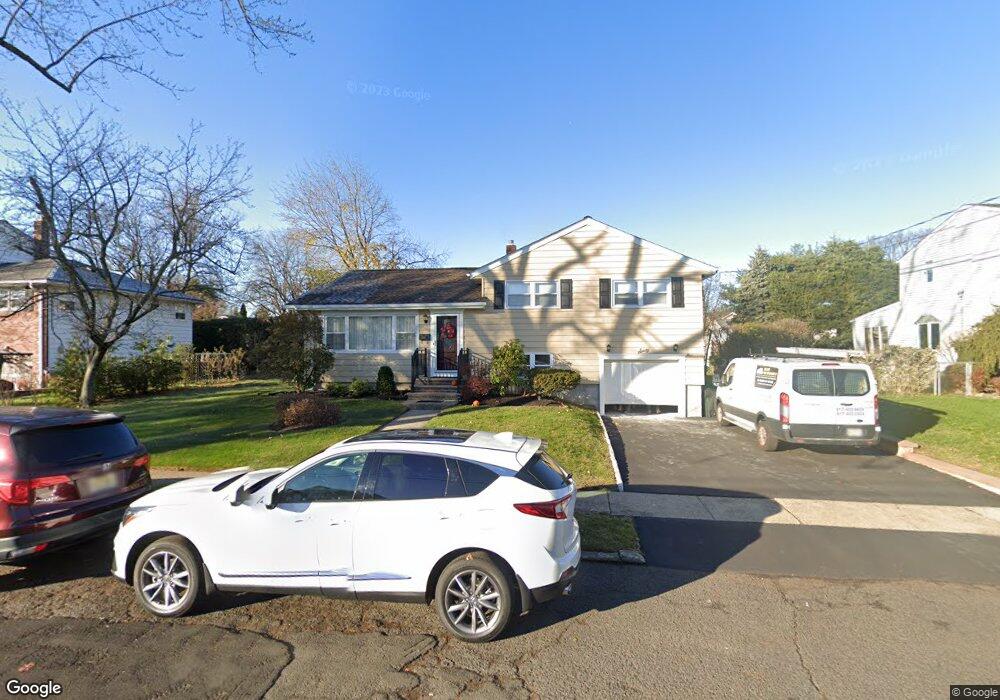
60 Juniper St Dumont, NJ 07628
Estimated Value: $623,956 - $712,000
Studio
--
Bath
1,508
Sq Ft
$446/Sq Ft
Est. Value
About This Home
This home is located at 60 Juniper St, Dumont, NJ 07628 and is currently estimated at $672,489, approximately $445 per square foot. 60 Juniper St is a home located in Bergen County with nearby schools including Dumont High School.
Ownership History
Date
Name
Owned For
Owner Type
Purchase Details
Closed on
Aug 15, 2018
Sold by
Charles Epstein T
Bought by
Dejesus Arcelie and Dejesus Ramos-Buencamino M
Current Estimated Value
Home Financials for this Owner
Home Financials are based on the most recent Mortgage that was taken out on this home.
Original Mortgage
$356,250
Outstanding Balance
$309,389
Interest Rate
4.5%
Mortgage Type
Purchase Money Mortgage
Estimated Equity
$363,100
Purchase Details
Closed on
Nov 2, 2017
Sold by
Epstein Emanuel H and Epstein Rita
Bought by
Charles Esptein Ret and Epstein Tr Jay
Create a Home Valuation Report for This Property
The Home Valuation Report is an in-depth analysis detailing your home's value as well as a comparison with similar homes in the area
Home Values in the Area
Average Home Value in this Area
Purchase History
| Date | Buyer | Sale Price | Title Company |
|---|---|---|---|
| Dejesus Arcelie | $375,000 | -- | |
| Charles Esptein Ret | -- | -- |
Source: Public Records
Mortgage History
| Date | Status | Borrower | Loan Amount |
|---|---|---|---|
| Open | Dejesus Arcelie | $356,250 |
Source: Public Records
Tax History
| Year | Tax Paid | Tax Assessment Tax Assessment Total Assessment is a certain percentage of the fair market value that is determined by local assessors to be the total taxable value of land and additions on the property. | Land | Improvement |
|---|---|---|---|---|
| 2025 | $12,358 | $532,100 | $335,400 | $196,700 |
| 2024 | $12,054 | $304,000 | $180,600 | $123,400 |
| 2023 | $11,804 | $304,000 | $180,600 | $123,400 |
| 2022 | $11,804 | $304,000 | $180,600 | $123,400 |
| 2021 | $11,747 | $304,000 | $180,600 | $123,400 |
| 2020 | $11,427 | $304,000 | $180,600 | $123,400 |
| 2019 | $11,154 | $304,000 | $180,600 | $123,400 |
| 2018 | $10,926 | $304,000 | $180,600 | $123,400 |
| 2017 | $10,716 | $304,000 | $180,600 | $123,400 |
| 2016 | $10,467 | $304,000 | $180,600 | $123,400 |
| 2015 | $9,977 | $304,000 | $180,600 | $123,400 |
| 2014 | $9,776 | $304,000 | $180,600 | $123,400 |
Source: Public Records
Map
Nearby Homes
Your Personal Tour Guide
Ask me questions while you tour the home.