Estimated Value: $334,105 - $410,000
--
Bed
3
Baths
1,717
Sq Ft
$224/Sq Ft
Est. Value
About This Home
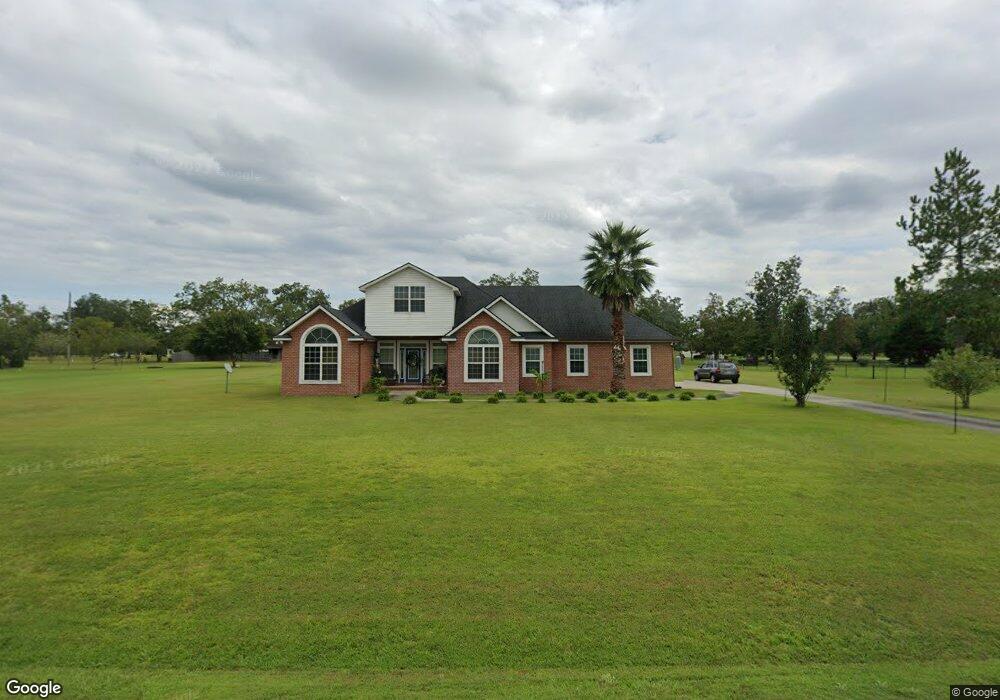
This home is located at 60 Margaret Boykin Rd, Odum, GA 31555 and is currently estimated at $383,776, approximately $223 per square foot. 60 Margaret Boykin Rd is a home located in Wayne County with nearby schools including Bacon Elementary School, Martha Puckett Middle School, and Wayne County High School.
Ownership History
Date
Name
Owned For
Owner Type
Purchase Details
Closed on
Aug 22, 2006
Sold by
Jones Salinda
Bought by
Jones Charles and Jones Salinda
Current Estimated Value
Purchase Details
Closed on
Dec 16, 2005
Sold by
Moore Michael A
Bought by
Jones Salinda
Home Financials for this Owner
Home Financials are based on the most recent Mortgage that was taken out on this home.
Original Mortgage
$39,600
Outstanding Balance
$21,885
Interest Rate
6.28%
Mortgage Type
New Conventional
Estimated Equity
$361,891
Purchase Details
Closed on
Apr 15, 2005
Sold by
Williams Marguerite O
Bought by
Moore Michael A
Home Financials for this Owner
Home Financials are based on the most recent Mortgage that was taken out on this home.
Original Mortgage
$187,885
Interest Rate
5.88%
Mortgage Type
New Conventional
Purchase Details
Closed on
May 1, 2000
Create a Home Valuation Report for This Property
The Home Valuation Report is an in-depth analysis detailing your home's value as well as a comparison with similar homes in the area
Home Values in the Area
Average Home Value in this Area
Purchase History
| Date | Buyer | Sale Price | Title Company |
|---|---|---|---|
| Jones Charles | -- | -- | |
| Jones Salinda | $198,000 | -- | |
| Moore Michael A | $37,500 | -- | |
| -- | $9,000 | -- |
Source: Public Records
Mortgage History
| Date | Status | Borrower | Loan Amount |
|---|---|---|---|
| Open | Jones Salinda | $39,600 | |
| Open | Jones Salinda | $158,400 | |
| Previous Owner | Moore Michael A | $187,885 |
Source: Public Records
Tax History Compared to Growth
Tax History
| Year | Tax Paid | Tax Assessment Tax Assessment Total Assessment is a certain percentage of the fair market value that is determined by local assessors to be the total taxable value of land and additions on the property. | Land | Improvement |
|---|---|---|---|---|
| 2024 | $3,390 | $132,984 | $10,000 | $122,984 |
| 2023 | $3,534 | $117,800 | $10,000 | $107,800 |
| 2022 | $2,882 | $96,541 | $10,000 | $86,541 |
| 2021 | $2,495 | $78,994 | $10,000 | $68,994 |
| 2020 | $2,581 | $78,994 | $10,000 | $68,994 |
| 2019 | $2,658 | $78,994 | $10,000 | $68,994 |
| 2018 | $2,658 | $78,994 | $10,000 | $68,994 |
| 2017 | $2,254 | $77,879 | $10,000 | $67,879 |
| 2016 | $2,181 | $77,879 | $10,000 | $67,879 |
| 2014 | $2,187 | $77,879 | $10,000 | $67,879 |
| 2013 | -- | $77,878 | $10,000 | $67,878 |
Source: Public Records
Map
Nearby Homes
- 31 Boardwalk Ave
- 141 Boardwalk Ave
- 67 Boardwalk Ave
- 99 Jekyll Island Rd
- 0 Red Oak Dr Unit 160341
- 0 Red Oak Dr Unit SA331365
- 17 Jekyll Island Rd
- 98 Saint Simons St
- 1 Palm Island Cir
- 0 Palm Island Cir
- 818 Kaitlyn Ave
- 75 Woodlawn Dr
- Lot 1,2,3 Rayonier Rd
- 556 Caleb Cir
- 143 Caleb Cir
- 586 Caleb Cir
- 440 Oak Island Estates Rd
- 186 Community Cir
- 71 Cruz Rd
- 131 Mill Creek Ln
- 19 Margaret Boykin Rd
- 12 Margaret Boykin Rd
- 20 Margaret Boykin Rd Unit 1
- 20 Margaret Boykin Rd
- 20 Margaret Boykin Rd
- 90 Margaret Boykin Rd
- 59 Margaret Boykin Rd
- 89 Margaret Boykin Rd
- 75 Foxwood Dr
- 21 Foxwood Dr
- 109 Foxwood Dr
- 62 Earl Boykin Rd
- 1239 Tank Rd
- 150 Margaret Boykin Rd
- 24 Earl Boykin Rd
- 116 Earl Boykin Rd
- 1207 Tank Rd
- 149 Foxwood Dr
- 173 Margaret Boykin Rd
- 247 Margaret Boykin Rd