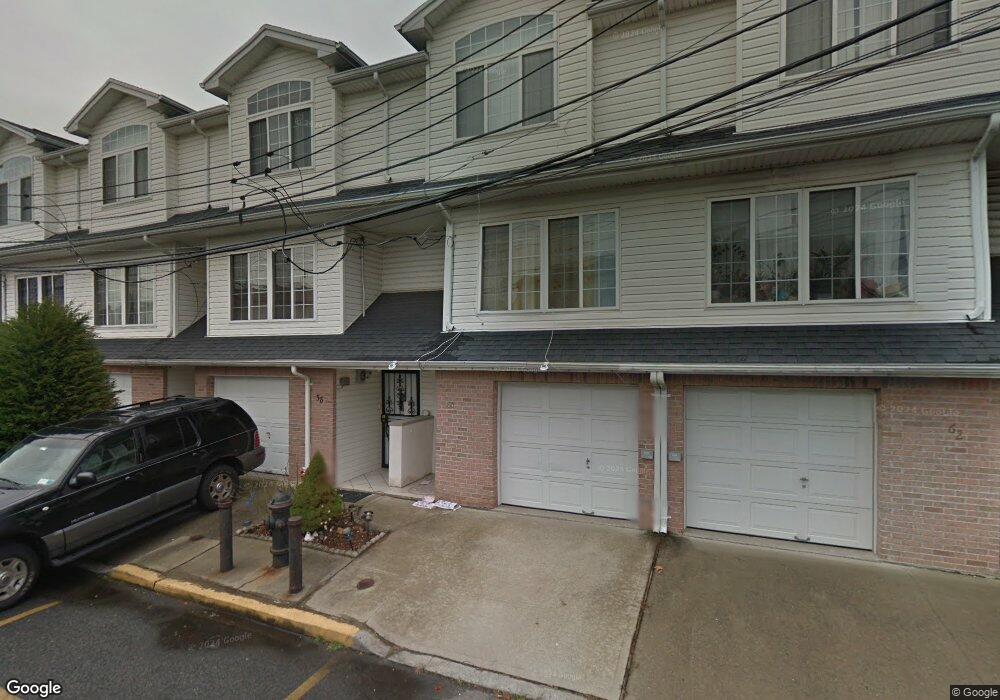
60 Margo Loop Staten Island, NY 10301
Tompkinsville NeighborhoodEstimated Value: $574,943 - $672,000
3
Beds
3
Baths
1,550
Sq Ft
$416/Sq Ft
Est. Value
About This Home
This home is located at 60 Margo Loop, Staten Island, NY 10301 and is currently estimated at $644,986, approximately $416 per square foot. 60 Margo Loop is a home located in Richmond County with nearby schools including P.S. 16 John J Driscoll, P.S. 74 Future Leaders Elementary School, and Fort Hill Collaborative Elementary.
Ownership History
Date
Name
Owned For
Owner Type
Purchase Details
Closed on
Jan 29, 2001
Sold by
Bayview Partners Inc
Bought by
Wong Bobby and Yuan Cindy
Current Estimated Value
Home Financials for this Owner
Home Financials are based on the most recent Mortgage that was taken out on this home.
Original Mortgage
$139,000
Interest Rate
7.13%
Create a Home Valuation Report for This Property
The Home Valuation Report is an in-depth analysis detailing your home's value as well as a comparison with similar homes in the area
Home Values in the Area
Average Home Value in this Area
Purchase History
| Date | Buyer | Sale Price | Title Company |
|---|---|---|---|
| Wong Bobby | $203,000 | United General Title Ins Co |
Source: Public Records
Mortgage History
| Date | Status | Borrower | Loan Amount |
|---|---|---|---|
| Previous Owner | Wong Bobby | $139,000 |
Source: Public Records
Tax History
| Year | Tax Paid | Tax Assessment Tax Assessment Total Assessment is a certain percentage of the fair market value that is determined by local assessors to be the total taxable value of land and additions on the property. | Land | Improvement |
|---|---|---|---|---|
| 2025 | $4,047 | $32,220 | $2,863 | $29,357 |
| 2024 | $4,047 | $27,060 | $3,217 | $23,843 |
| 2023 | $3,818 | $19,008 | $2,857 | $16,151 |
| 2022 | $3,508 | $28,200 | $4,320 | $23,880 |
| 2021 | $3,667 | $27,480 | $4,320 | $23,160 |
| 2020 | $4,295 | $25,560 | $4,320 | $21,240 |
| 2019 | $3,219 | $22,260 | $4,320 | $17,940 |
| 2018 | $2,931 | $15,840 | $4,320 | $11,520 |
| 2017 | $3,356 | $17,935 | $4,276 | $13,659 |
| 2016 | $3,073 | $16,920 | $4,047 | $12,873 |
| 2015 | $2,585 | $15,963 | $3,182 | $12,781 |
| 2014 | $2,585 | $15,060 | $3,600 | $11,460 |
Source: Public Records
Map
Nearby Homes
- 65 Grant St
- 67 Grant St
- 69 Grant St
- 63 Grant St
- 66 Grant St
- 19 Brewster St
- 31 Brewster St
- 65 St Pauls Ave
- 58 van Duzer St
- 47,49 Tompkins Cir
- 47 Tompkins Cir
- 67 Brewster St
- 75 Brewster St
- 0 van Duzer St Unit 2601424
- 0 van Duzer St Unit 499828
- 78 Victory Blvd
- 155 Bay St Unit 4C
- 155 Bay St Unit 4F
- 155 Bay St Unit 5B
- 115 Victory Blvd
Your Personal Tour Guide
Ask me questions while you tour the home.