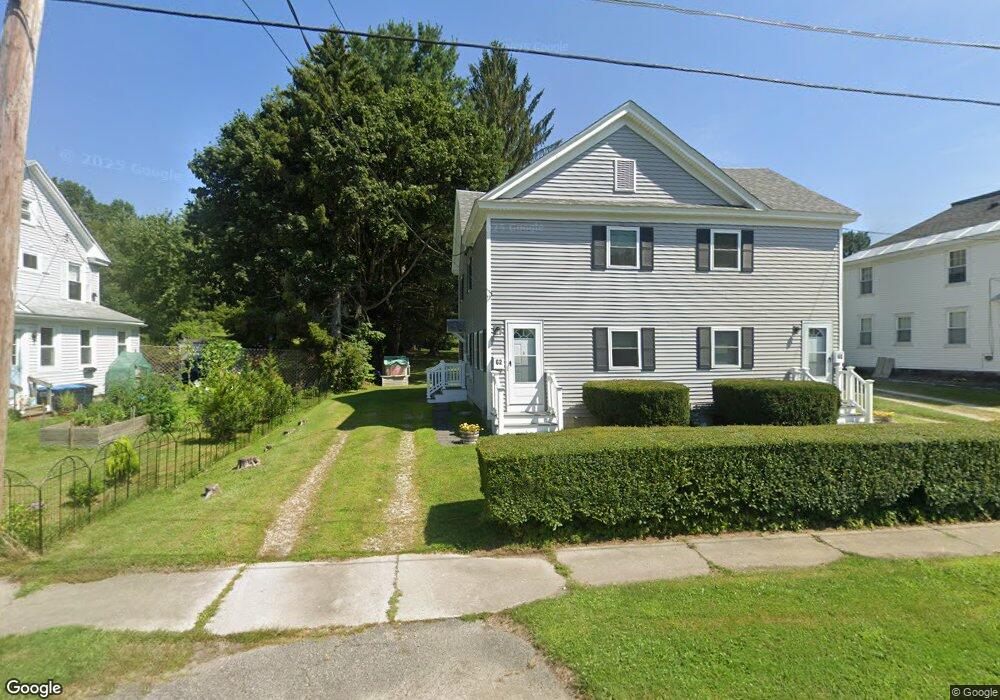
60 Mcarthur St Pittsfield, MA 01201
Estimated Value: $220,000 - $257,000
6
Beds
2
Baths
2,376
Sq Ft
$97/Sq Ft
Est. Value
About This Home
This home is located at 60 Mcarthur St, Pittsfield, MA 01201 and is currently estimated at $231,364, approximately $97 per square foot. 60 Mcarthur St is a home located in Berkshire County with nearby schools including Silvio O. Conte Community School, John T. Reid Middle School, and Taconic High School.
Ownership History
Date
Name
Owned For
Owner Type
Purchase Details
Closed on
Jul 21, 2021
Sold by
Mccarthy Michael W and Mccarthy Joanne M
Bought by
M & J Mccarthy Ret
Current Estimated Value
Purchase Details
Closed on
Jul 17, 2007
Sold by
Mccarthy Michael W and Mccarthy Kenneth J
Bought by
Mccarthy Michael W
Purchase Details
Closed on
Aug 23, 2006
Sold by
Mccarthy Eugene T
Bought by
Mccarthy Kenneth J and Mccarthy Michael W
Create a Home Valuation Report for This Property
The Home Valuation Report is an in-depth analysis detailing your home's value as well as a comparison with similar homes in the area
Home Values in the Area
Average Home Value in this Area
Purchase History
| Date | Buyer | Sale Price | Title Company |
|---|---|---|---|
| M & J Mccarthy Ret | -- | None Available | |
| M & J Mccarthy Ret | -- | None Available | |
| Mccarthy Michael W | -- | -- | |
| Mccarthy Kenneth J | -- | -- |
Source: Public Records
Mortgage History
| Date | Status | Borrower | Loan Amount |
|---|---|---|---|
| Previous Owner | Mccarthy Kenneth J | $40,000 |
Source: Public Records
Tax History Compared to Growth
Tax History
| Year | Tax Paid | Tax Assessment Tax Assessment Total Assessment is a certain percentage of the fair market value that is determined by local assessors to be the total taxable value of land and additions on the property. | Land | Improvement |
|---|---|---|---|---|
| 2025 | $2,734 | $152,400 | $57,800 | $94,600 |
| 2024 | $2,550 | $138,200 | $57,800 | $80,400 |
| 2023 | $2,299 | $125,500 | $52,300 | $73,200 |
| 2022 | $2,177 | $117,300 | $48,300 | $69,000 |
| 2021 | $2,198 | $114,200 | $48,300 | $65,900 |
| 2020 | $2,208 | $112,000 | $48,300 | $63,700 |
| 2019 | $2,274 | $117,100 | $48,300 | $68,800 |
| 2018 | $2,279 | $113,900 | $48,300 | $65,600 |
| 2017 | $2,342 | $119,300 | $50,300 | $69,000 |
| 2016 | $2,270 | $121,000 | $50,300 | $70,700 |
| 2015 | $2,185 | $121,000 | $50,300 | $70,700 |
Source: Public Records
Map
Nearby Homes