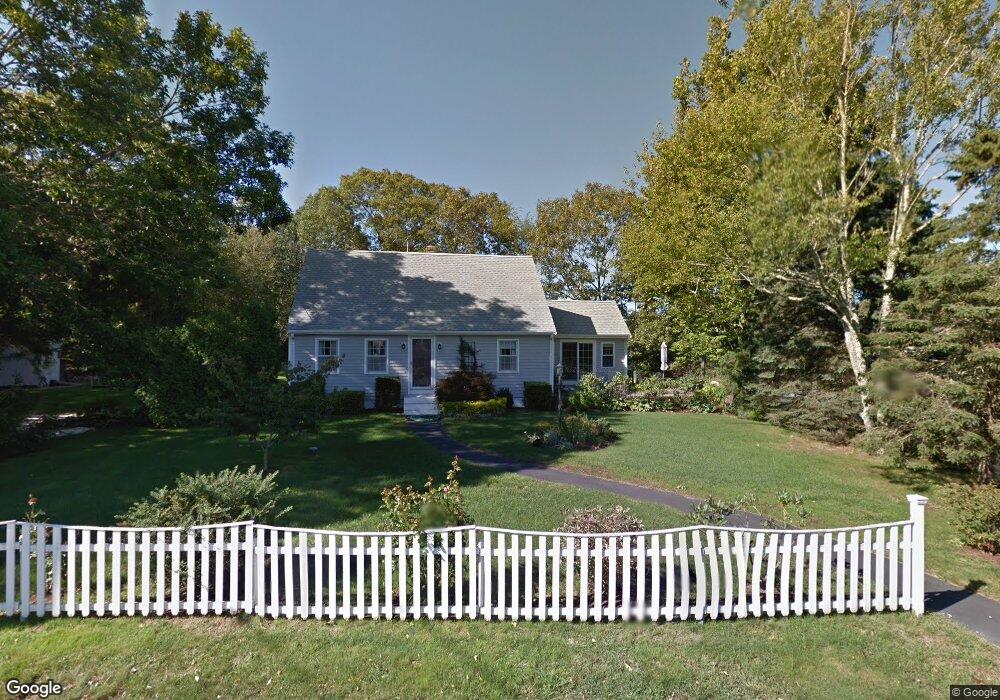
60 Meadow Rd Westport, MA 02790
North Westport NeighborhoodEstimated Value: $444,000 - $551,000
2
Beds
--
Bath
1,411
Sq Ft
$363/Sq Ft
Est. Value
About This Home
This home is located at 60 Meadow Rd, Westport, MA 02790 and is currently estimated at $512,219, approximately $363 per square foot. 60 Meadow Rd is a home located in Bristol County with nearby schools including Alice A. Macomber Primary School, Westport Elementary School, and Westport Middle-High School.
Ownership History
Date
Name
Owned For
Owner Type
Purchase Details
Closed on
Dec 22, 2005
Sold by
Longview Estates Rt
Bought by
Stetson Bradford L and Stetson Patricia A
Current Estimated Value
Purchase Details
Closed on
Jan 8, 2004
Sold by
Huard Janet L
Bought by
Longview Ests Rt and Mulford Ralph K
Create a Home Valuation Report for This Property
The Home Valuation Report is an in-depth analysis detailing your home's value as well as a comparison with similar homes in the area
Home Values in the Area
Average Home Value in this Area
Purchase History
| Date | Buyer | Sale Price | Title Company |
|---|---|---|---|
| Stetson Bradford L | $225,000 | -- | |
| Longview Ests Rt | $400,000 | -- | |
| Longview Estates Rt | $275,000 | -- |
Source: Public Records
Mortgage History
| Date | Status | Borrower | Loan Amount |
|---|---|---|---|
| Previous Owner | Longview Estates Rt | $10,000 | |
| Previous Owner | Longview Estates Rt | $8,000 |
Source: Public Records
Tax History Compared to Growth
Tax History
| Year | Tax Paid | Tax Assessment Tax Assessment Total Assessment is a certain percentage of the fair market value that is determined by local assessors to be the total taxable value of land and additions on the property. | Land | Improvement |
|---|---|---|---|---|
| 2025 | $3,316 | $445,100 | $164,700 | $280,400 |
| 2024 | $2,933 | $379,400 | $152,600 | $226,800 |
| 2023 | $2,895 | $354,800 | $139,000 | $215,800 |
| 2022 | $2,629 | $310,000 | $126,300 | $183,700 |
| 2021 | $6,432 | $292,900 | $114,900 | $178,000 |
| 2020 | $2,430 | $288,300 | $110,300 | $178,000 |
| 2019 | $667 | $282,200 | $110,300 | $171,900 |
| 2018 | $5,485 | $246,700 | $118,400 | $128,300 |
| 2017 | $5,276 | $251,700 | $118,400 | $133,300 |
| 2016 | $1,991 | $251,700 | $118,400 | $133,300 |
| 2015 | $1,925 | $242,800 | $118,400 | $124,400 |
Source: Public Records
Map
Nearby Homes
- 218 American Legion Hwy
- 47 Devol Ave
- 33 Moniz Dr
- 771 Sanford Rd
- 40 Robert St
- 51 Newton St
- 6 Angel Ct
- 0 Tickle Rd Unit 73453134
- 219 Tickle Rd
- 47 Robert St
- 100 Cory's Ln
- 100 Corys Ln
- 308 Robert St
- 8 Campion Ave
- 14 Glendale Ave
- 0 Crandall Rd
- 75 Montgomery St
- 1125 Stafford Rd Unit 5
- 100 D Dr
- 92 Benoit St