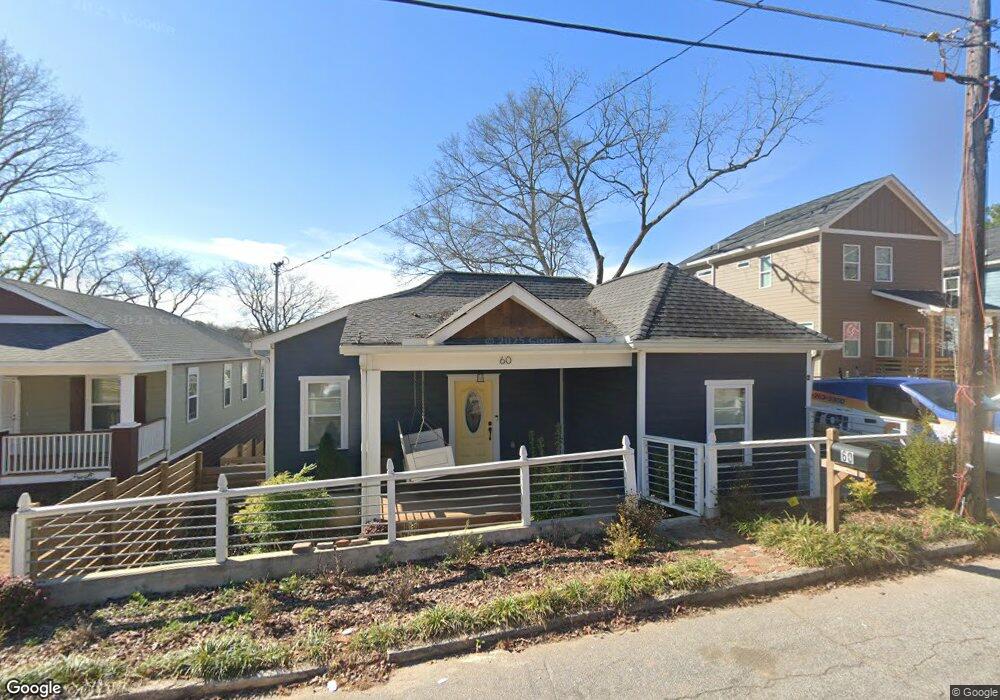
60 Meldon Avenue Se 0 Atlanta, GA 30315
South Atlanta NeighborhoodEstimated Value: $215,000 - $348,000
3
Beds
2
Baths
907
Sq Ft
$294/Sq Ft
Est. Value
About This Home
This home is located at 60 Meldon Avenue Se 0, Atlanta, GA 30315 and is currently estimated at $266,547, approximately $293 per square foot. 60 Meldon Avenue Se 0 is a home located in Fulton County with nearby schools including Slater Elementary School, Price Middle School, and Carver High School.
Ownership History
Date
Name
Owned For
Owner Type
Purchase Details
Closed on
Aug 16, 2019
Sold by
Hr & Jm Construction Investments Llc
Bought by
Miller Paul
Current Estimated Value
Home Financials for this Owner
Home Financials are based on the most recent Mortgage that was taken out on this home.
Original Mortgage
$230,755
Outstanding Balance
$202,513
Interest Rate
3.8%
Mortgage Type
New Conventional
Estimated Equity
$64,034
Purchase Details
Closed on
Aug 31, 2018
Sold by
Tdres 2016 Llc
Bought by
Hr
Purchase Details
Closed on
Jun 1, 2017
Sold by
Tdspt 2012 Llc
Bought by
Tdres 2016 Llc
Purchase Details
Closed on
Jun 7, 2016
Sold by
Miranda
Bought by
Tdspt 2012 Llc
Purchase Details
Closed on
Oct 20, 2006
Sold by
Haygood John L and Haygood Patricia J
Bought by
Henry-Phillip Loydon and Henry-Phillip Miranda
Home Financials for this Owner
Home Financials are based on the most recent Mortgage that was taken out on this home.
Original Mortgage
$90,300
Interest Rate
6.45%
Create a Home Valuation Report for This Property
The Home Valuation Report is an in-depth analysis detailing your home's value as well as a comparison with similar homes in the area
Home Values in the Area
Average Home Value in this Area
Purchase History
| Date | Buyer | Sale Price | Title Company |
|---|---|---|---|
| Miller Paul | $242,900 | -- | |
| Hr | $15,000 | -- | |
| Tdres 2016 Llc | -- | -- | |
| Tdspt 2012 Llc | $4,997 | -- | |
| Henry-Phillip Loydon | $70,000 | -- |
Source: Public Records
Mortgage History
| Date | Status | Borrower | Loan Amount |
|---|---|---|---|
| Open | Miller Paul | $230,755 | |
| Previous Owner | Henry-Phillip Loydon | $90,300 |
Source: Public Records
Tax History Compared to Growth
Tax History
| Year | Tax Paid | Tax Assessment Tax Assessment Total Assessment is a certain percentage of the fair market value that is determined by local assessors to be the total taxable value of land and additions on the property. | Land | Improvement |
|---|---|---|---|---|
| 2025 | $1,786 | $101,040 | $24,040 | $77,000 |
| 2023 | $4,335 | $104,720 | $38,560 | $66,160 |
| 2022 | $1,416 | $87,160 | $26,040 | $61,120 |
| 2021 | $764 | $55,600 | $20,000 | $35,600 |
| 2020 | $2,250 | $54,920 | $19,760 | $35,160 |
| 2019 | $485 | $49,600 | $18,840 | $30,760 |
| 2018 | $214 | $5,160 | $4,120 | $1,040 |
| 2017 | $455 | $12,400 | $3,960 | $8,440 |
| 2016 | $537 | $12,400 | $3,960 | $8,440 |
| 2015 | $1,006 | $12,400 | $3,960 | $8,440 |
| 2014 | $562 | $12,400 | $3,960 | $8,440 |
Source: Public Records
Map
Nearby Homes
- 85 Meldon Ave SE
- 92 Park Ave SE
- 94 Moury Ave SE
- 62 Hardwick St SE
- 36 Park Ave SE
- 59 Brown Ave SE
- 0 Crogman St SE Unit 10560811
- 1631 Burton St SE
- 54 Brown Ave SE
- 19 Moury Ave SE
- 0 SE Margaret St
- 95 Thirkield Ave SE
- 71 Thayer Ave SE
- 1595 Jonesboro Rd SE
- 1765 Lakewood Ave SE
- 75 Bisbee Ave SE
- 58 Bisbee Ave SE
- 1640 Lakewood Ave SE
- 60 Meldon Ave SE
- 58 Meldon Ave SE
- 58 Meldon Ave SE Unit 35
- 62 Meldon Ave SE
- 56 Meldon Ave SE
- 66 Meldon Ave SE
- 59 Meldon Ave SE
- 57 Meldon Ave SE
- 52 Meldon Ave SE
- 55 Meldon Ave SE
- 65 Meldon Ave SE
- 51 Meldon Ave SE
- 68 Meldon Ave SE
- 46 Meldon Ave SE
- 69 Meldon Ave SE
- 70 Meldon Ave SE
- 47 Meldon Ave SE
- 44 Meldon Ave SE
- 71 Meldon Ave SE
- 90 Park Ave SE