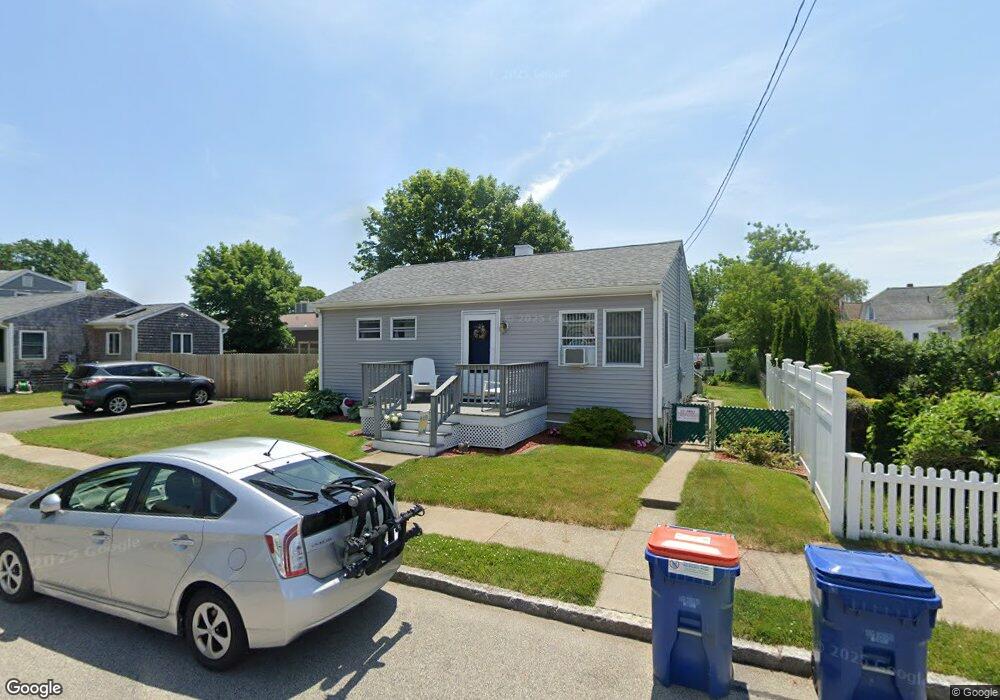
60 Milton St New Bedford, MA 02740
Westview Park NeighborhoodEstimated Value: $294,000 - $383,000
2
Beds
1
Bath
768
Sq Ft
$459/Sq Ft
Est. Value
About This Home
This home is located at 60 Milton St, New Bedford, MA 02740 and is currently estimated at $352,866, approximately $459 per square foot. 60 Milton St is a home located in Bristol County with nearby schools including Elizabeth Carter Brooks Elementary School, Keith Middle School, and New Bedford High School.
Ownership History
Date
Name
Owned For
Owner Type
Purchase Details
Closed on
Nov 5, 2022
Sold by
Mills Allen E and Mills Kimberly M
Bought by
Mills Allen E and Mills Kimberly M
Current Estimated Value
Purchase Details
Closed on
Mar 11, 1991
Sold by
Shea Mary M Est
Bought by
Mills Allen E and Mills Kimberly M
Home Financials for this Owner
Home Financials are based on the most recent Mortgage that was taken out on this home.
Original Mortgage
$76,000
Interest Rate
9.51%
Mortgage Type
Purchase Money Mortgage
Create a Home Valuation Report for This Property
The Home Valuation Report is an in-depth analysis detailing your home's value as well as a comparison with similar homes in the area
Home Values in the Area
Average Home Value in this Area
Purchase History
| Date | Buyer | Sale Price | Title Company |
|---|---|---|---|
| Mills Allen E | -- | None Available | |
| Mills Allen E | -- | None Available | |
| Mills Allen E | $80,000 | -- |
Source: Public Records
Mortgage History
| Date | Status | Borrower | Loan Amount |
|---|---|---|---|
| Previous Owner | Mills Allen E | $106,000 | |
| Previous Owner | Mills Allen E | $102,500 | |
| Previous Owner | Mills Allen E | $76,000 |
Source: Public Records
Tax History Compared to Growth
Tax History
| Year | Tax Paid | Tax Assessment Tax Assessment Total Assessment is a certain percentage of the fair market value that is determined by local assessors to be the total taxable value of land and additions on the property. | Land | Improvement |
|---|---|---|---|---|
| 2025 | $3,695 | $326,700 | $102,300 | $224,400 |
| 2024 | $3,473 | $289,400 | $112,700 | $176,700 |
| 2023 | $3,613 | $252,800 | $94,700 | $158,100 |
| 2022 | $3,279 | $211,000 | $90,200 | $120,800 |
| 2021 | $3,163 | $202,900 | $86,700 | $116,200 |
| 2020 | $3,036 | $187,900 | $86,700 | $101,200 |
| 2019 | $2,943 | $178,700 | $86,700 | $92,000 |
| 2018 | $2,731 | $164,200 | $86,700 | $77,500 |
| 2017 | $2,530 | $151,600 | $81,500 | $70,100 |
| 2016 | $2,335 | $141,600 | $79,800 | $61,800 |
| 2015 | $2,205 | $140,200 | $81,500 | $58,700 |
| 2014 | $2,133 | $140,700 | $81,500 | $59,200 |
Source: Public Records
Map
Nearby Homes
- 469 Hillman St
- ) Hapwell & Summit St
- 35 Jenny Lind St
- 124 Francis St
- 317 Commonwealth Ave
- 295 Commonwealth Ave
- 59 Longwood Ave
- 245 Brownell St
- 0 Middlesex St
- 50 Gaywood St
- 605 Union St
- 0 Norfolk Ave Unit 73403282
- 417 Maxfield St
- 122 Armour St
- 179 Tremont St
- 26 Keene St
- 69 Newton St
- 35 Suffolk Ave
- 82 Pierce St
- 354-358 Arnold St
- 114 Jenny Lind St
- 50 Milton St
- 110 Jenny Lind St
- 106 Jenny Lind St
- 65 Milton St
- 102 Jenny Lind St
- 44 Milton St
- 69 Milton St
- 59 Milton St
- 43 Milton St
- 51 Milton St
- 98 Jenny Lind St
- 38 Milton St
- 66 Rogers St
- 113 Jenny Lind St
- 39 Milton St
- 117 Jenny Lind St
- 105 Jenny Lind St
- 96 Jenny Lind St
- 50 Rogers St