60 Mountain Spring Rd Stevens, PA 17578
Estimated Value: $298,000 - $700,958
4
Beds
4
Baths
2,892
Sq Ft
$161/Sq Ft
Est. Value
About This Home
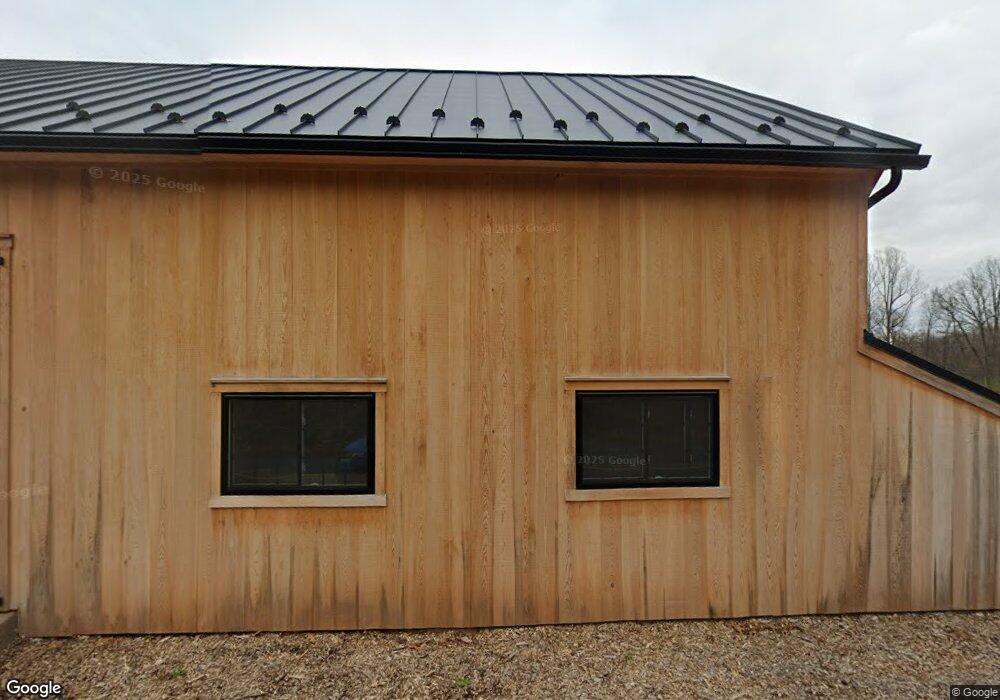
This home is located at 60 Mountain Spring Rd, Stevens, PA 17578 and is currently estimated at $466,490, approximately $161 per square foot. 60 Mountain Spring Rd is a home located in Lancaster County with nearby schools including Clay Elementary School, Ephrata Intermediate School, and Ephrata Senior High School.
Ownership History
Date
Name
Owned For
Owner Type
Purchase Details
Closed on
Jul 19, 2016
Sold by
Meier Robert A
Bought by
Weaver Philip A and Weaver Katilyn J
Current Estimated Value
Home Financials for this Owner
Home Financials are based on the most recent Mortgage that was taken out on this home.
Original Mortgage
$108,000
Outstanding Balance
$85,984
Interest Rate
3.58%
Mortgage Type
Construction
Estimated Equity
$380,506
Purchase Details
Closed on
Jun 20, 2016
Sold by
Estate Of Robert A Meier
Bought by
Weaver Heath B and Weaver Jennifer R
Home Financials for this Owner
Home Financials are based on the most recent Mortgage that was taken out on this home.
Original Mortgage
$108,000
Outstanding Balance
$85,984
Interest Rate
3.58%
Mortgage Type
Construction
Estimated Equity
$380,506
Create a Home Valuation Report for This Property
The Home Valuation Report is an in-depth analysis detailing your home's value as well as a comparison with similar homes in the area
Home Values in the Area
Average Home Value in this Area
Purchase History
| Date | Buyer | Sale Price | Title Company |
|---|---|---|---|
| Weaver Philip A | $240,000 | None Available | |
| Weaver Heath B | $135,000 | None Available |
Source: Public Records
Mortgage History
| Date | Status | Borrower | Loan Amount |
|---|---|---|---|
| Open | Weaver Heath B | $108,000 |
Source: Public Records
Tax History
| Year | Tax Paid | Tax Assessment Tax Assessment Total Assessment is a certain percentage of the fair market value that is determined by local assessors to be the total taxable value of land and additions on the property. | Land | Improvement |
|---|---|---|---|---|
| 2025 | $9,772 | $426,700 | $142,400 | $284,300 |
| 2024 | $9,772 | $426,700 | $142,400 | $284,300 |
| 2023 | $9,520 | $426,700 | $142,400 | $284,300 |
| 2022 | $9,302 | $426,700 | $142,400 | $284,300 |
| 2021 | $9,102 | $426,700 | $142,400 | $284,300 |
| 2020 | $8,980 | $421,000 | $142,400 | $278,600 |
| 2019 | $8,854 | $421,000 | $142,400 | $278,600 |
| 2018 | $7,008 | $421,000 | $142,400 | $278,600 |
| 2017 | $4,878 | $191,400 | $87,300 | $104,100 |
| 2016 | $4,878 | $191,400 | $87,300 | $104,100 |
| 2015 | $964 | $191,400 | $87,300 | $104,100 |
| 2014 | $3,624 | $191,400 | $87,300 | $104,100 |
Source: Public Records
Map
Nearby Homes
- 570 Mountain Top Dr
- 10 Harvest Dr
- 100 Lilly Dr
- 142 Tulip Cir
- 85 Fox Rd
- 2002 W Main St Unit 74
- 2002 W Main St Unit 63
- 433 Sheep Hill Rd
- 4790 Stiegel Pike
- 230 Hickory Dr
- 125 Indiantown Rd
- 85 Wissler Rd
- 490 Weidmansville Rd
- 0 Weidmansville Rd
- 131 Distillery Rd
- 239 Kimberly Ln
- 144 Sunrise Ln
- 131 Sunrise Ln
- 720 S Cocalico Rd
- 740 S Cocalico Rd
- 0 Mountain Spring Rd
- 0 Mountain Spring Rd
- 67 Mountain Spring Rd
- 75 Mountain Spring Rd
- 63 Mountain Spring Rd
- 90 Mountain Spring Rd
- 95 Mountain Spring Rd
- 40 Mountain Spring Rd
- 135 Mountain Spring Rd
- 1266 Sun Valley Rd
- 145 Mountain Spring Rd
- 120 Mountain Spring Rd
- 8 Mountain Spring Rd
- 20 Mountain Spring Rd
- 10 Mountain Spring Rd
- 175 Mountain Spring Rd
- 1480 Kleinfeltersville Rd
- 1490 Kleinfeltersville Rd
- 1210 Sun Valley Rd
- 1250 Sun Valley Rd
Your Personal Tour Guide
Ask me questions while you tour the home.