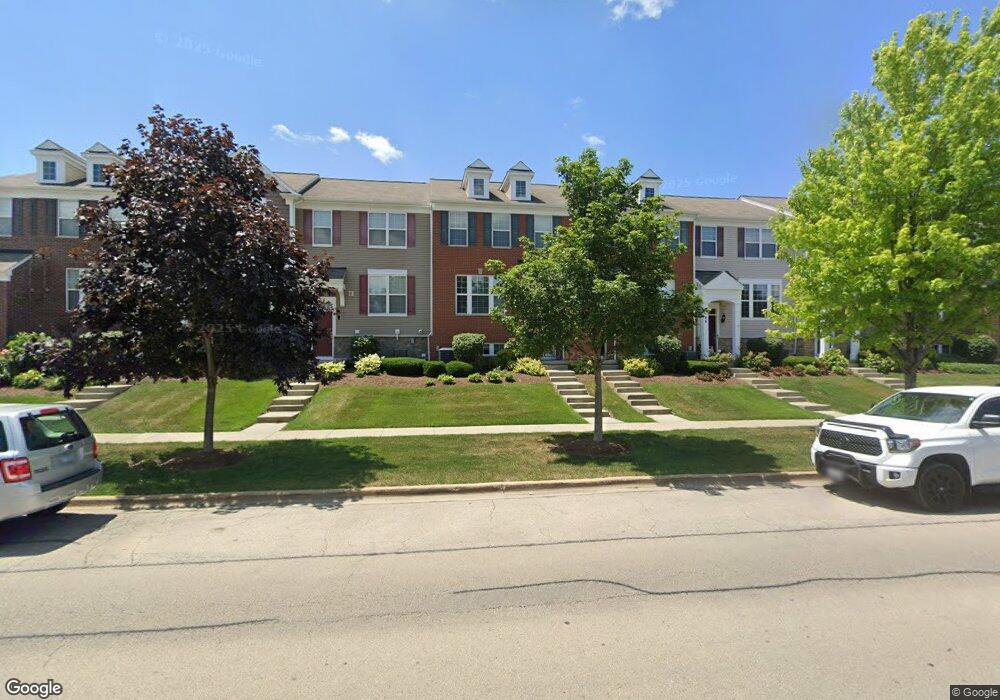
60 N Dryden Place Unit 1-4 Arlington Heights, IL 60004
Estimated Value: $499,000 - $529,000
3
Beds
3
Baths
1,736
Sq Ft
$293/Sq Ft
Est. Value
About This Home
This home is located at 60 N Dryden Place Unit 1-4, Arlington Heights, IL 60004 and is currently estimated at $509,024, approximately $293 per square foot. 60 N Dryden Place Unit 1-4 is a home located in Cook County with nearby schools including Windsor Elementary School, South Middle School, and Prospect High School.
Ownership History
Date
Name
Owned For
Owner Type
Purchase Details
Closed on
Jun 26, 2024
Sold by
Keith And Nancy Brunelli Trust and Brunnelli Keith
Bought by
Verduzco Bonny
Current Estimated Value
Home Financials for this Owner
Home Financials are based on the most recent Mortgage that was taken out on this home.
Original Mortgage
$385,600
Outstanding Balance
$381,328
Interest Rate
7.38%
Mortgage Type
New Conventional
Estimated Equity
$127,696
Purchase Details
Closed on
Jul 1, 2022
Sold by
Heimdahl Leah K
Bought by
Keith And Nancy Brunelli Trust and Brunelli
Purchase Details
Closed on
Jan 5, 2011
Sold by
Pulte Home Corporation
Bought by
Heimdahl Leah K
Home Financials for this Owner
Home Financials are based on the most recent Mortgage that was taken out on this home.
Original Mortgage
$280,158
Interest Rate
4.75%
Mortgage Type
FHA
Create a Home Valuation Report for This Property
The Home Valuation Report is an in-depth analysis detailing your home's value as well as a comparison with similar homes in the area
Home Values in the Area
Average Home Value in this Area
Purchase History
| Date | Buyer | Sale Price | Title Company |
|---|---|---|---|
| Verduzco Bonny | $482,000 | None Listed On Document | |
| Keith And Nancy Brunelli Trust | $400,000 | Chicago Title | |
| Heimdahl Leah K | $307,500 | None Available |
Source: Public Records
Mortgage History
| Date | Status | Borrower | Loan Amount |
|---|---|---|---|
| Open | Verduzco Bonny | $385,600 | |
| Previous Owner | Heimdahl Leah K | $280,158 |
Source: Public Records
Tax History Compared to Growth
Tax History
| Year | Tax Paid | Tax Assessment Tax Assessment Total Assessment is a certain percentage of the fair market value that is determined by local assessors to be the total taxable value of land and additions on the property. | Land | Improvement |
|---|---|---|---|---|
| 2024 | $8,495 | $37,001 | $6,001 | $31,000 |
| 2023 | $8,132 | $37,001 | $6,001 | $31,000 |
| 2022 | $8,132 | $37,001 | $6,001 | $31,000 |
| 2021 | $8,285 | $30,854 | $682 | $30,172 |
| 2020 | $9,047 | $30,854 | $682 | $30,172 |
| 2019 | $9,001 | $34,283 | $682 | $33,601 |
| 2018 | $9,176 | $31,445 | $600 | $30,845 |
| 2017 | $9,068 | $31,445 | $600 | $30,845 |
| 2016 | $8,458 | $31,445 | $600 | $30,845 |
| 2015 | $8,245 | $27,922 | $518 | $27,404 |
| 2014 | $8,004 | $27,922 | $518 | $27,404 |
| 2013 | $7,803 | $27,922 | $518 | $27,404 |
Source: Public Records
Map
Nearby Homes
- 805 E Hamlin Ln
- 315 S Beverly Ln
- 816 E Mayfair Rd
- 32 N Belmont Ave
- 415 N Haddow Ave
- 315 N Drury Ln
- 104 N Pine Ave Unit 505
- 1615 E Miner St
- 417 S Dryden Place
- 1209 E Davis St
- 423 S Beverly Ln
- 430 S Dryden Place
- 201 S Stratford Rd
- 77 S Evergreen Ave Unit 606
- 300 E Euclid Ave
- 1804 E Euclid Ave
- 530 S Dryden Place
- 534 S Dryden Place
- 25 N Prindle Ave
- 500 E Mayfair Rd
- 60 N Dryden Place
- 62 N Dryden Place
- 58 N Dryden Place Unit 1-3
- 58 N Dryden Place
- 64 N Dryden Place Unit 1-6
- 64 N Dryden Place
- 56 N Dryden Place
- 56 N Dryden Place Unit 1-2
- 66 N Dryden Place
- 54 N Dryden Place Unit 1
- 68 N Dryden Place Unit 1-8
- 68 N Dryden Place
- 915 E Hamlin Ln
- 916 E Wing St Unit 2-6
- 916 E Wing St
- 918 E Wing St
- 913 E Hamlin Ln
- 911 E Hamlin Ln Unit 3-4
- 911 E Hamlin Ln
- 912 E Wing St Unit 2-4