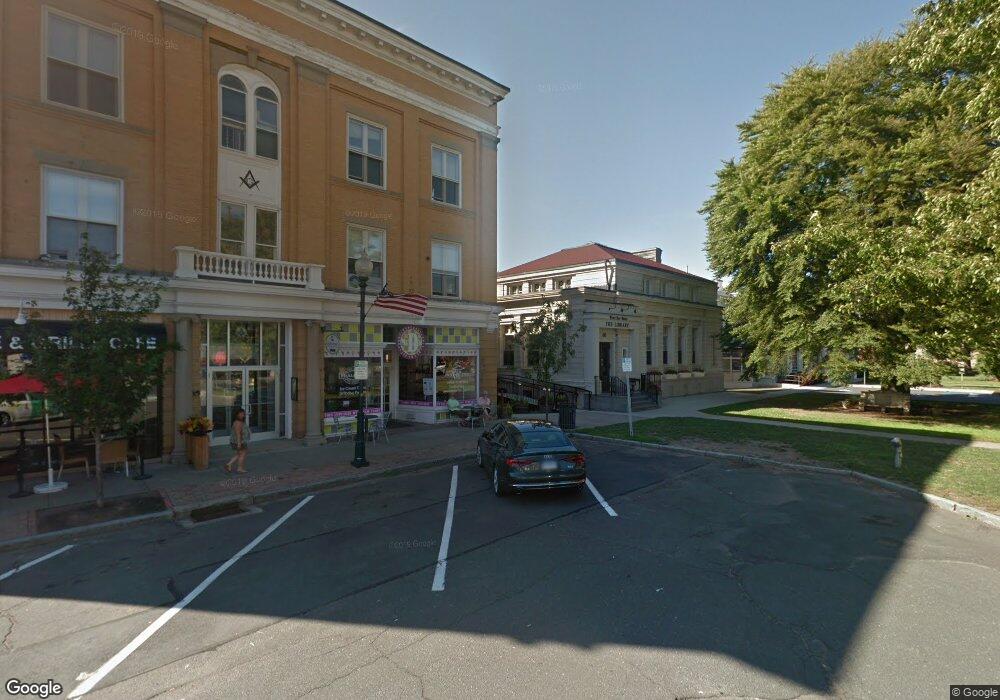
60 N Main St Wallingford, CT 06492
Estimated Value: $1,634,088
--
Bed
2
Baths
9,899
Sq Ft
$165/Sq Ft
Est. Value
About This Home
This home is located at 60 N Main St, Wallingford, CT 06492 and is currently estimated at $1,634,088, approximately $165 per square foot. 60 N Main St is a home located in New Haven County with nearby schools including Moses Y Beach Elementary School, Rock Hill Elementary School, and Dag Hammarskjold Middle School.
Ownership History
Date
Name
Owned For
Owner Type
Purchase Details
Closed on
May 16, 2013
Sold by
Ulbrich Frederick C
Bought by
60 N Main Street Llc
Current Estimated Value
Purchase Details
Closed on
Dec 12, 2002
Sold by
Bourland & Miller Asso
Bought by
Ulbrich Frederick C
Create a Home Valuation Report for This Property
The Home Valuation Report is an in-depth analysis detailing your home's value as well as a comparison with similar homes in the area
Home Values in the Area
Average Home Value in this Area
Purchase History
| Date | Buyer | Sale Price | Title Company |
|---|---|---|---|
| 60 N Main Street Llc | $800,000 | -- | |
| 60 N Main Street Llc | $800,000 | -- | |
| Ulbrich Frederick C | $1,260,000 | -- | |
| Ulbrich Frederick C | $1,260,000 | -- |
Source: Public Records
Mortgage History
| Date | Status | Borrower | Loan Amount |
|---|---|---|---|
| Previous Owner | Ulbrich Frederick C | $300,000 | |
| Previous Owner | Ulbrich Frederick C | $360,000 | |
| Previous Owner | Ulbrich Frederick C | $65,000 |
Source: Public Records
Tax History Compared to Growth
Tax History
| Year | Tax Paid | Tax Assessment Tax Assessment Total Assessment is a certain percentage of the fair market value that is determined by local assessors to be the total taxable value of land and additions on the property. | Land | Improvement |
|---|---|---|---|---|
| 2025 | $24,216 | $1,004,000 | $75,800 | $928,200 |
| 2024 | $23,562 | $768,500 | $72,000 | $696,500 |
| 2023 | $22,548 | $768,500 | $72,000 | $696,500 |
| 2022 | $22,317 | $768,500 | $72,000 | $696,500 |
| 2021 | $21,918 | $768,500 | $72,000 | $696,500 |
| 2020 | $95,046 | $721,700 | $64,800 | $656,900 |
| 2019 | $21,066 | $721,700 | $64,800 | $656,900 |
| 2018 | $20,669 | $721,700 | $64,800 | $656,900 |
| 2017 | $20,605 | $721,700 | $64,800 | $656,900 |
| 2016 | $20,128 | $721,700 | $64,800 | $656,900 |
| 2015 | $16,715 | $608,500 | $65,800 | $542,700 |
| 2014 | $12,730 | $473,400 | $67,100 | $406,300 |
Source: Public Records
Map
Nearby Homes
- 43 Academy St
- 29 Curtis Ave
- 67 Spring St
- 39 Hoffman Ct Unit B3
- 85 N Colony St
- 530 Center St Unit C1
- 148 Judd Square Unit 148
- 180 S Whittlesey Ave
- 49 High St
- 120 S Cherry St
- 210 S Elm St
- 19 Carriage Dr
- 15 Marshall St
- 40 Lake St
- 26 West St
- 109 Clifton St
- 44 3rd St
- 333 S Elm St
- 6 Holly Ln
- 30 Clinton Place
- 48 N Main St
- 86 N Main St
- 36/40 N Main St
- 36 N Main St Unit 3
- 36 N Main St Unit 2
- 36 N Main St
- 36 N Main St Unit 1
- 33 N Whittlesey Ave
- 39 N Whittlesey Ave
- 29 N Whittlesey Ave
- 43 N Whittlesey Ave
- 135 Church St
- 131 Church St
- 2 N Main St
- 127 Church St
- 50 N Main St
- 50 N Main St Unit 3rd Floor
- 33 N Main St
- 123 Church St
- 40 N Main St Unit 3