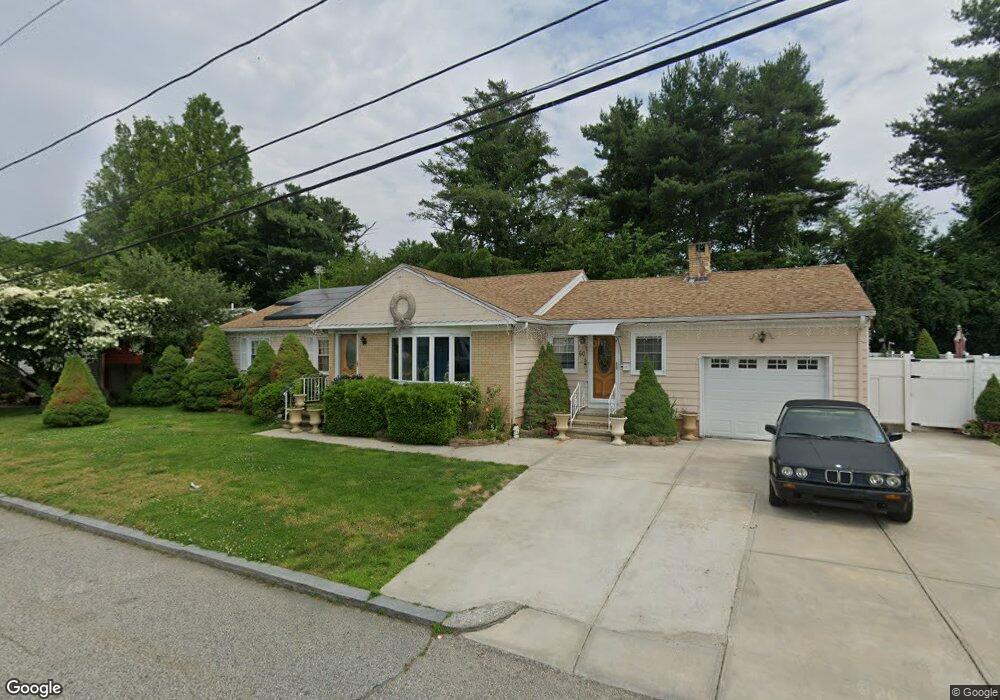
60 Netop Dr Providence, RI 02907
South Elmwood NeighborhoodEstimated Value: $437,000 - $530,000
3
Beds
4
Baths
2,205
Sq Ft
$221/Sq Ft
Est. Value
About This Home
This home is located at 60 Netop Dr, Providence, RI 02907 and is currently estimated at $486,702, approximately $220 per square foot. 60 Netop Dr is a home located in Providence County with nearby schools including Asa Messer Elementary School, Charles N. Fortes Elementary School, and Alfred Lima Sr. Elementary School.
Ownership History
Date
Name
Owned For
Owner Type
Purchase Details
Closed on
Feb 16, 2023
Sold by
Santana Maria A
Bought by
Santana Maria A and Santana Julio C
Current Estimated Value
Home Financials for this Owner
Home Financials are based on the most recent Mortgage that was taken out on this home.
Original Mortgage
$317,460
Outstanding Balance
$304,270
Interest Rate
5.12%
Mortgage Type
FHA
Estimated Equity
$182,432
Purchase Details
Closed on
Jul 30, 2004
Sold by
Johnson Peter L
Bought by
Santana Maria A
Purchase Details
Closed on
Dec 2, 1996
Sold by
Tomasso Raymond A and Tomasso John P
Bought by
Johnson Peter L
Create a Home Valuation Report for This Property
The Home Valuation Report is an in-depth analysis detailing your home's value as well as a comparison with similar homes in the area
Home Values in the Area
Average Home Value in this Area
Purchase History
| Date | Buyer | Sale Price | Title Company |
|---|---|---|---|
| Santana Maria A | -- | None Available | |
| Santana Maria A | -- | None Available | |
| Santana Maria A | -- | None Available | |
| Santana Maria A | $220,000 | -- | |
| Johnson Peter L | $96,000 | -- | |
| Santana Maria A | $220,000 | -- | |
| Johnson Peter L | $96,000 | -- |
Source: Public Records
Mortgage History
| Date | Status | Borrower | Loan Amount |
|---|---|---|---|
| Open | Santana Maria A | $317,460 | |
| Closed | Santana Maria A | $317,460 | |
| Previous Owner | Johnson Peter L | $262,000 | |
| Previous Owner | Johnson Peter L | $247,500 |
Source: Public Records
Tax History Compared to Growth
Tax History
| Year | Tax Paid | Tax Assessment Tax Assessment Total Assessment is a certain percentage of the fair market value that is determined by local assessors to be the total taxable value of land and additions on the property. | Land | Improvement |
|---|---|---|---|---|
| 2025 | $3,347 | $398,400 | $136,800 | $261,600 |
| 2024 | $5,580 | $304,100 | $91,900 | $212,200 |
| 2023 | $5,580 | $304,100 | $91,900 | $212,200 |
| 2022 | $5,413 | $304,100 | $91,900 | $212,200 |
| 2021 | $5,779 | $235,300 | $63,800 | $171,500 |
| 2020 | $5,779 | $235,300 | $63,800 | $171,500 |
| 2019 | $5,779 | $235,300 | $63,800 | $171,500 |
| 2018 | $5,309 | $166,100 | $58,000 | $108,100 |
| 2017 | $5,309 | $166,100 | $58,000 | $108,100 |
| 2016 | $5,309 | $166,100 | $58,000 | $108,100 |
| 2015 | $5,481 | $165,600 | $65,800 | $99,800 |
| 2014 | $5,589 | $165,600 | $65,800 | $99,800 |
| 2013 | $5,589 | $165,600 | $65,800 | $99,800 |
Source: Public Records
Map
Nearby Homes