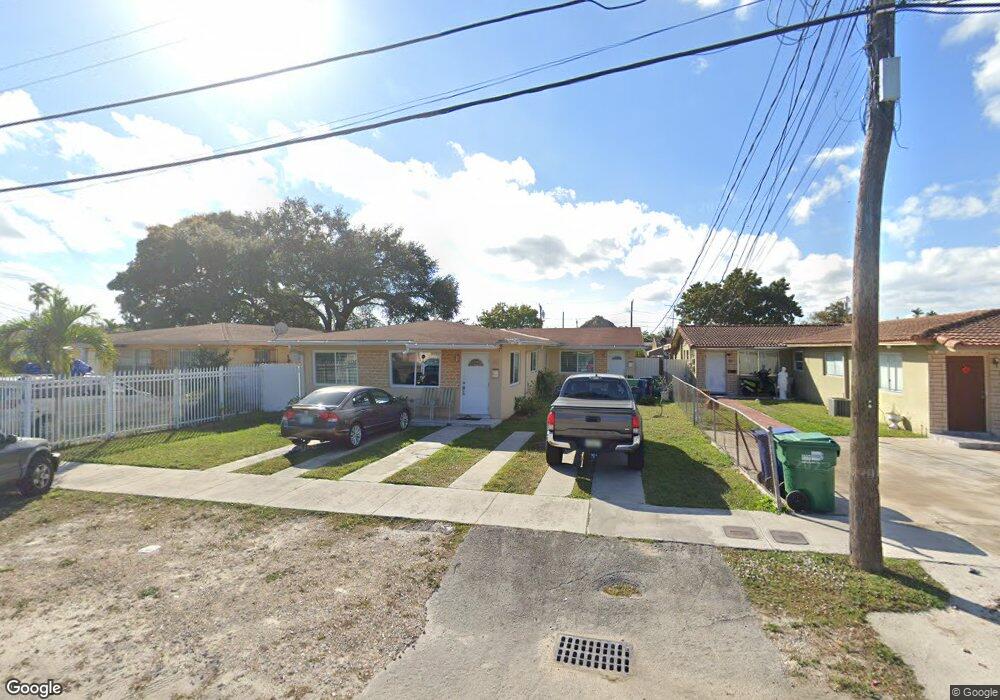
60 NW 74th Ave Miami, FL 33126
Flagami NeighborhoodEstimated Value: $663,085 - $934,000
4
Beds
2
Baths
2,550
Sq Ft
$307/Sq Ft
Est. Value
About This Home
This home is located at 60 NW 74th Ave, Miami, FL 33126 and is currently estimated at $782,271, approximately $306 per square foot. 60 NW 74th Ave is a home located in Miami-Dade County with nearby schools including Seminole Elementary School, West Miami Middle School, and South Miami Senior High School.
Ownership History
Date
Name
Owned For
Owner Type
Purchase Details
Closed on
Dec 31, 2020
Sold by
Giner Ramon A and Arias Maria Magdalena
Bought by
Gil Frank and Capaz Neysa
Current Estimated Value
Home Financials for this Owner
Home Financials are based on the most recent Mortgage that was taken out on this home.
Original Mortgage
$488,822
Outstanding Balance
$436,199
Interest Rate
2.7%
Mortgage Type
FHA
Estimated Equity
$346,072
Purchase Details
Closed on
Aug 7, 2007
Sold by
Pena Orlando R and Mederos Gloria
Bought by
Giner Ramon A and Arias Arsenio Giner
Home Financials for this Owner
Home Financials are based on the most recent Mortgage that was taken out on this home.
Original Mortgage
$260,800
Interest Rate
6.62%
Mortgage Type
Unknown
Purchase Details
Closed on
May 10, 2006
Sold by
Pena Orlando R
Bought by
Pena Orlando R and Mederos Gloria
Purchase Details
Closed on
Mar 2, 2005
Sold by
Pena Ramon J
Bought by
Pena Orlando R
Create a Home Valuation Report for This Property
The Home Valuation Report is an in-depth analysis detailing your home's value as well as a comparison with similar homes in the area
Home Values in the Area
Average Home Value in this Area
Purchase History
| Date | Buyer | Sale Price | Title Company |
|---|---|---|---|
| Gil Frank | $500,000 | Attorney | |
| Giner Ramon A | $326,000 | Attorney | |
| Pena Orlando R | -- | None Available | |
| Pena Orlando R | -- | -- |
Source: Public Records
Mortgage History
| Date | Status | Borrower | Loan Amount |
|---|---|---|---|
| Open | Gil Frank | $488,822 | |
| Previous Owner | Giner Ramon A | $260,800 |
Source: Public Records
Tax History Compared to Growth
Tax History
| Year | Tax Paid | Tax Assessment Tax Assessment Total Assessment is a certain percentage of the fair market value that is determined by local assessors to be the total taxable value of land and additions on the property. | Land | Improvement |
|---|---|---|---|---|
| 2025 | $8,258 | $463,753 | -- | -- |
| 2024 | $7,736 | $445,276 | -- | -- |
| 2023 | $7,736 | $427,897 | $0 | $0 |
| 2022 | $10,018 | $411,006 | $0 | $0 |
| 2021 | $9,873 | $395,009 | $169,000 | $226,009 |
| 2020 | $5,365 | $288,953 | $0 | $0 |
| 2019 | $5,195 | $278,652 | $0 | $0 |
| 2018 | $4,245 | $238,221 | $0 | $0 |
| 2017 | $4,005 | $214,693 | $0 | $0 |
| 2016 | $3,804 | $201,895 | $0 | $0 |
| 2015 | $3,650 | $191,396 | $0 | $0 |
| 2014 | -- | $186,408 | $0 | $0 |
Source: Public Records
Map
Nearby Homes
- 66 NW 73rd Place
- 77 Northwest Blvd
- 7335 W Flagler St
- 14 dr Northwest Dr
- 7375 NW 4th St
- 7230 NW 3rd St
- 110 Flagami Blvd
- 295 NW 72nd Ave Unit 412
- 415 Flagami Blvd
- 399 NW 72nd Ave Unit 209
- 325 NW 72av Unit 206
- 325 NW 72nd Ave Unit 308
- 460 Grand Canal Dr
- 530 Tamiami Blvd
- 255 Central Blvd
- 495 NW 72nd Ave Unit 408
- 495 NW 72nd Ave Unit 305
- 7373 SW 6th St
- 605 NW 72nd Ave Unit 406
- 670 Flagami Blvd