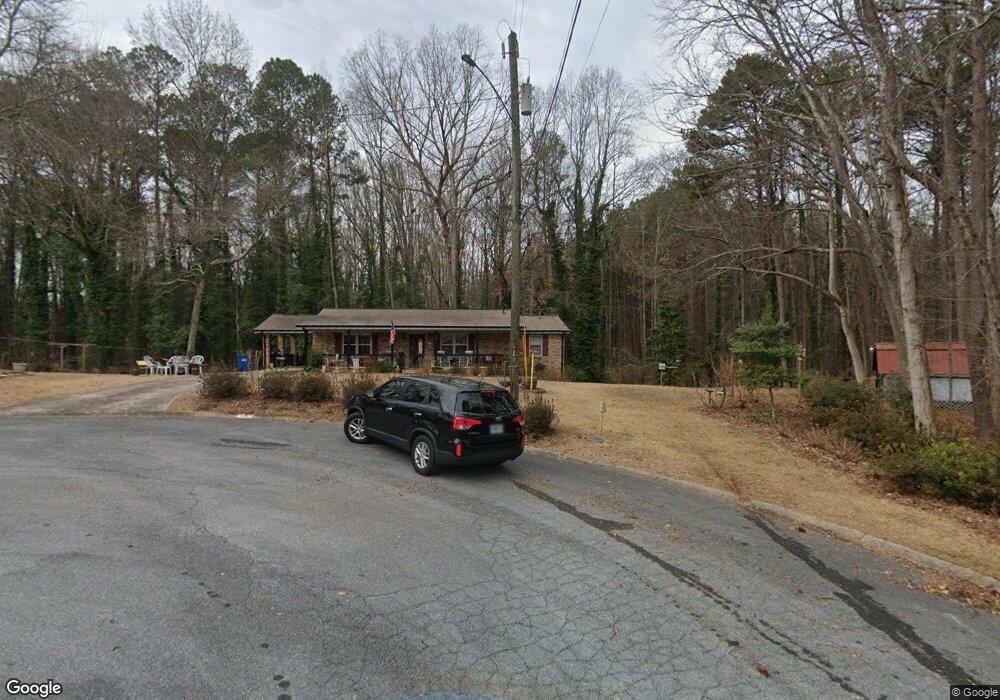
60 Oakwood Ct Dallas, GA 30157
Estimated Value: $274,906 - $396,000
4
Beds
2
Baths
1,372
Sq Ft
$229/Sq Ft
Est. Value
About This Home
This home is located at 60 Oakwood Ct, Dallas, GA 30157 and is currently estimated at $314,227, approximately $229 per square foot. 60 Oakwood Ct is a home located in Paulding County with nearby schools including Allgood Elementary School, South Paulding Middle School, and Paulding County High School.
Ownership History
Date
Name
Owned For
Owner Type
Purchase Details
Closed on
Mar 27, 2023
Sold by
Wright Harry G
Bought by
Wright Harry G and Baxter Mildred H
Current Estimated Value
Purchase Details
Closed on
May 24, 2001
Sold by
Dykes Mildred H
Bought by
Wright Harry G and Wright Amy L
Home Financials for this Owner
Home Financials are based on the most recent Mortgage that was taken out on this home.
Original Mortgage
$65,600
Interest Rate
7.23%
Mortgage Type
New Conventional
Purchase Details
Closed on
Jan 10, 2001
Sold by
Dykes Anthony R
Bought by
Dykes Mildred H
Create a Home Valuation Report for This Property
The Home Valuation Report is an in-depth analysis detailing your home's value as well as a comparison with similar homes in the area
Home Values in the Area
Average Home Value in this Area
Purchase History
| Date | Buyer | Sale Price | Title Company |
|---|---|---|---|
| Wright Harry G | -- | -- | |
| Wright Harry G | $82,000 | -- | |
| Dykes Mildred H | $2,500 | -- |
Source: Public Records
Mortgage History
| Date | Status | Borrower | Loan Amount |
|---|---|---|---|
| Previous Owner | Wright Harry G | $65,600 |
Source: Public Records
Tax History Compared to Growth
Tax History
| Year | Tax Paid | Tax Assessment Tax Assessment Total Assessment is a certain percentage of the fair market value that is determined by local assessors to be the total taxable value of land and additions on the property. | Land | Improvement |
|---|---|---|---|---|
| 2024 | $796 | $119,096 | $18,000 | $101,096 |
| 2023 | $960 | $121,384 | $18,000 | $103,384 |
| 2022 | $751 | $94,244 | $18,000 | $76,244 |
| 2021 | $679 | $69,872 | $12,000 | $57,872 |
| 2020 | $659 | $64,184 | $12,480 | $51,704 |
| 2019 | $581 | $55,044 | $12,000 | $43,044 |
| 2018 | $451 | $44,128 | $9,000 | $35,128 |
| 2017 | $457 | $43,184 | $9,000 | $34,184 |
| 2016 | $377 | $37,180 | $8,160 | $29,020 |
| 2015 | $327 | $31,616 | $9,000 | $22,616 |
| 2014 | $342 | $31,188 | $9,000 | $22,188 |
| 2013 | -- | $23,280 | $9,000 | $14,280 |
Source: Public Records
Map
Nearby Homes