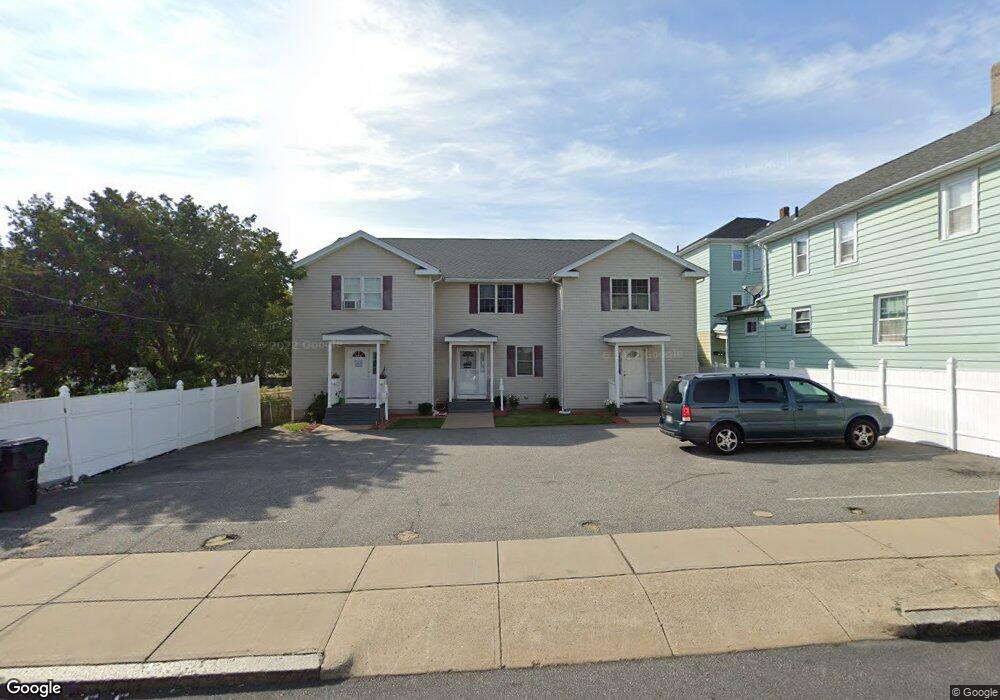
60 Orange St Unit 3 Fall River, MA 02720
Oak Grove Village NeighborhoodEstimated Value: $329,988 - $491,000
3
Beds
1
Bath
2,042
Sq Ft
$196/Sq Ft
Est. Value
About This Home
This home is located at 60 Orange St Unit 3, Fall River, MA 02720 and is currently estimated at $400,497, approximately $196 per square foot. 60 Orange St Unit 3 is a home located in Bristol County with nearby schools including Mary Fonseca Elementary School, Morton Middle School, and B M C Durfee High School.
Ownership History
Date
Name
Owned For
Owner Type
Purchase Details
Closed on
Sep 27, 2007
Sold by
G & J Prop Mgmt Corp
Bought by
Royal Susan M
Current Estimated Value
Home Financials for this Owner
Home Financials are based on the most recent Mortgage that was taken out on this home.
Original Mortgage
$199,000
Outstanding Balance
$125,932
Interest Rate
6.65%
Mortgage Type
Purchase Money Mortgage
Estimated Equity
$274,565
Create a Home Valuation Report for This Property
The Home Valuation Report is an in-depth analysis detailing your home's value as well as a comparison with similar homes in the area
Home Values in the Area
Average Home Value in this Area
Purchase History
| Date | Buyer | Sale Price | Title Company |
|---|---|---|---|
| Royal Susan M | $199,000 | -- | |
| Royal Susan M | $199,000 | -- |
Source: Public Records
Mortgage History
| Date | Status | Borrower | Loan Amount |
|---|---|---|---|
| Open | Royal Susan M | $199,000 | |
| Closed | Royal Susan M | $199,000 |
Source: Public Records
Tax History
| Year | Tax Paid | Tax Assessment Tax Assessment Total Assessment is a certain percentage of the fair market value that is determined by local assessors to be the total taxable value of land and additions on the property. | Land | Improvement |
|---|---|---|---|---|
| 2025 | $2,599 | $227,000 | $0 | $227,000 |
| 2024 | $2,543 | $221,300 | $0 | $221,300 |
| 2023 | $2,584 | $210,600 | $0 | $210,600 |
| 2022 | $2,630 | $197,700 | $0 | $197,700 |
| 2021 | $2,630 | $190,200 | $0 | $190,200 |
| 2020 | $2,270 | $157,100 | $0 | $157,100 |
| 2019 | $2,245 | $154,000 | $0 | $154,000 |
| 2018 | $2,056 | $140,600 | $0 | $140,600 |
| 2017 | $1,968 | $140,600 | $0 | $140,600 |
| 2016 | $1,863 | $136,700 | $0 | $136,700 |
| 2015 | $1,805 | $138,000 | $0 | $138,000 |
| 2014 | $1,868 | $148,500 | $0 | $148,500 |
Source: Public Records
Map
Nearby Homes
- 243 Robeson St Unit 6
- 243 Robeson St Unit 3
- 992 Pine St
- 273 Tremont St
- 884 Cherry St
- 218 Plain St
- 217 Plain St
- 120 15th St Unit 5
- 105 16th St
- 511 Bank St
- 869 Bedford St
- 464 Bank St Unit 10
- 84 Healy St
- 89 Oak St
- 139 Quarry St
- 631 Walnut St
- 528 Cherry St Unit 3
- 104 Oak St
- 233 Franklin St
- 229 Franklin St
- 60 Orange St
- 60 Orange St Unit 2
- 60 Orange St Unit 1
- 60 Orange St Unit C
- 60 Orange St Unit A
- 60 Orange St Unit B
- 70 Orange St
- 44 Orange St
- 67 Tremont St
- 41 Tremont St
- 41 Tremont St Unit 1
- 41 Tremont St Unit 2
- 46 Orange St Unit 3
- 46 Orange St
- 77 Tremont St
- 77 Tremont St Unit 3S
- 77 Tremont St Unit 3N
- 77 Tremont St Unit 2S
- 77 Tremont St Unit 1S
- 77 Tremont St Unit 1N
Your Personal Tour Guide
Ask me questions while you tour the home.