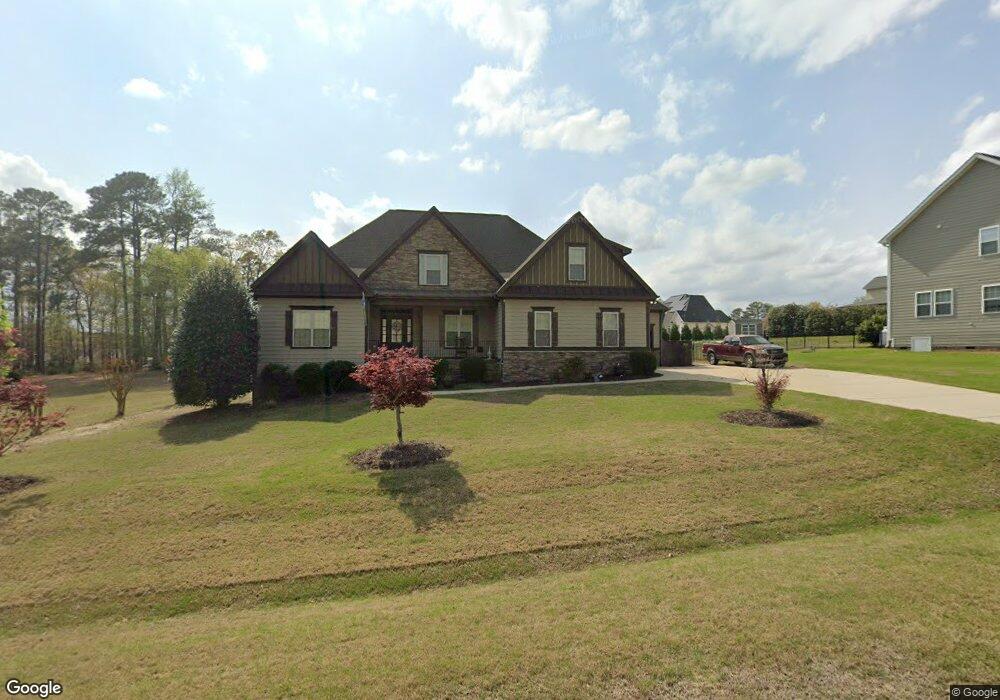
60 Pebble Creek Dr Unit LOT30 Angier, NC 27501
Pleasant Grove NeighborhoodEstimated Value: $534,362 - $623,000
3
Beds
4
Baths
3,011
Sq Ft
$192/Sq Ft
Est. Value
About This Home
This home is located at 60 Pebble Creek Dr Unit LOT30, Angier, NC 27501 and is currently estimated at $578,841, approximately $192 per square foot. 60 Pebble Creek Dr Unit LOT30 is a home located in Johnston County with nearby schools including McGee's Crossroads Elementary School, McGee's Crossroads Middle School, and West Johnston High School.
Ownership History
Date
Name
Owned For
Owner Type
Purchase Details
Closed on
Jul 18, 2023
Sold by
Stanley William W and Stanley Angela D
Bought by
Stanley Family Revocable Living Trust and Vandivier-Stanley
Current Estimated Value
Purchase Details
Closed on
Jun 6, 2014
Sold by
Genesis Living Inc
Bought by
Stanley William W and Vandivier Stanley Angela D
Home Financials for this Owner
Home Financials are based on the most recent Mortgage that was taken out on this home.
Original Mortgage
$332,500
Interest Rate
4.28%
Mortgage Type
New Conventional
Purchase Details
Closed on
Oct 14, 2013
Sold by
Nc Properties I Llc
Bought by
Genesis Living Inc
Purchase Details
Closed on
Sep 30, 2010
Sold by
Crm Mid Atlantic Properties Llc
Bought by
Nc Properties I Llc
Purchase Details
Closed on
Sep 10, 2009
Sold by
Marcus Edwards Development Llc
Bought by
Crm Mid Atlantic Properties Llc
Create a Home Valuation Report for This Property
The Home Valuation Report is an in-depth analysis detailing your home's value as well as a comparison with similar homes in the area
Home Values in the Area
Average Home Value in this Area
Purchase History
| Date | Buyer | Sale Price | Title Company |
|---|---|---|---|
| Stanley Family Revocable Living Trust | -- | None Listed On Document | |
| Stanley William W | $350,000 | None Available | |
| Genesis Living Inc | $40,000 | None Available | |
| Nc Properties I Llc | $121,500 | None Available | |
| Crm Mid Atlantic Properties Llc | $577,500 | None Available |
Source: Public Records
Mortgage History
| Date | Status | Borrower | Loan Amount |
|---|---|---|---|
| Previous Owner | Stanley William W | $332,500 |
Source: Public Records
Tax History Compared to Growth
Tax History
| Year | Tax Paid | Tax Assessment Tax Assessment Total Assessment is a certain percentage of the fair market value that is determined by local assessors to be the total taxable value of land and additions on the property. | Land | Improvement |
|---|---|---|---|---|
| 2025 | $3,679 | $579,410 | $70,000 | $509,410 |
| 2024 | $2,992 | $369,360 | $36,000 | $333,360 |
| 2023 | $2,899 | $369,360 | $36,000 | $333,360 |
| 2022 | $2,992 | $369,360 | $36,000 | $333,360 |
| 2021 | $2,992 | $369,360 | $36,000 | $333,360 |
| 2020 | $3,041 | $362,060 | $36,000 | $326,060 |
| 2019 | $2,969 | $362,060 | $36,000 | $326,060 |
| 2018 | $2,710 | $322,660 | $40,000 | $282,660 |
| 2017 | $2,710 | $322,660 | $40,000 | $282,660 |
| 2016 | $2,710 | $322,660 | $40,000 | $282,660 |
| 2015 | $1,453 | $322,660 | $40,000 | $282,660 |
| 2014 | $1,453 | $173,010 | $40,000 | $133,010 |
Source: Public Records
Map
Nearby Homes
- 19 Silverside Dr
- 135 Brookstone Way
- 197 Silverside Dr
- 230 Paula Dr
- 105 Pinecrest Dr
- 115 Wiggins Rd
- 19 Lake Refuge Ct
- 506 Harbor Cove Dr
- 250 Crosscreek Ln
- 38.2 Acres Wiggins Rd
- 100 Pine Needle Dr
- 376 Everland Pkwy
- 154 Everland Pkwy
- 264 Harbor Cove Dr
- 156 Harbor Cove Dr
- 232 Burrage Dr
- Cypress Plan at Cedar Ridge
- Wescott Plan at Cedar Ridge
- Colfax Plan at Cedar Ridge
- Edgefield Plan at Cedar Ridge
- 60 Pebble Creek Dr
- 40 Pebble Creek Dr Unit 31
- 40 Pebble Creek Dr
- 110 Pebble Creek Dr
- 14 Pebble Creek Dr
- 86 Pebble Creek Dr
- 14 Pebble Creek Dr Unit 32
- 86 Pebble Creek Dr Unit 29
- 0 Pebble Creek Dr
- 39 Silverside Dr
- 39 Silverside Dr Unit 34
- 59 Silverside Dr Unit 35
- 59 Silverside Dr
- 16 Ivy Hollow Ct
- 16 Ivy Hollow Ct Unit 12
- 25 Ivy Hollow Ct
- 25 Ivy Hollow Ct Unit 7
- 213 Brookstone Way
- 0 Ivy Hollow Ct Unit 520012
- 0 Ivy Hollow Ct Unit 520013