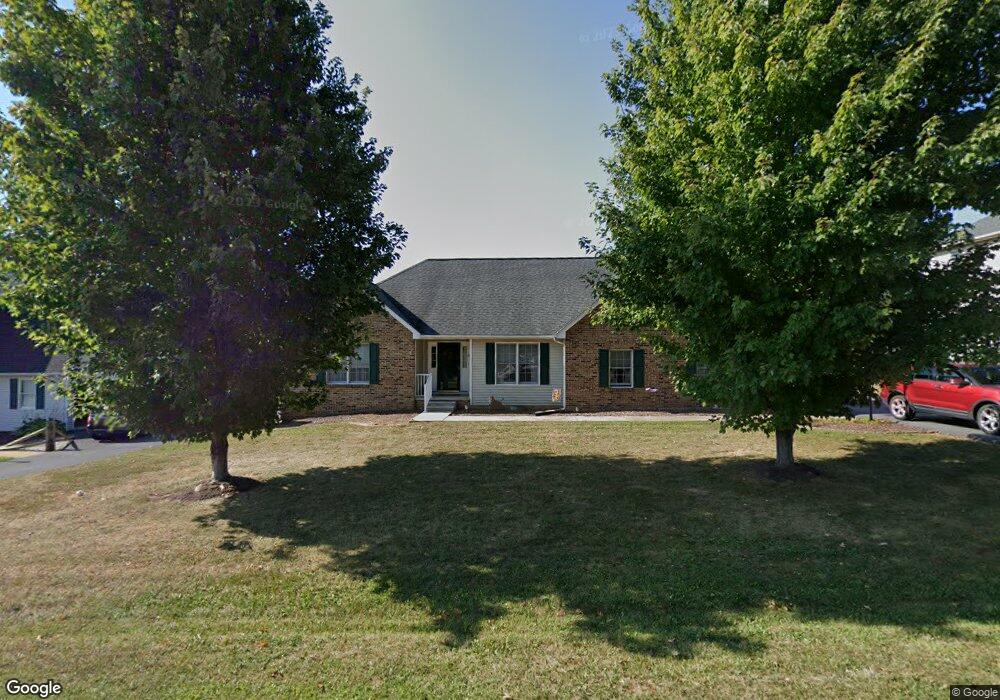
60 Pheasant Run Waynesboro, VA 22980
Estimated Value: $370,498 - $400,000
3
Beds
2
Baths
1,675
Sq Ft
$232/Sq Ft
Est. Value
About This Home
This home is located at 60 Pheasant Run, Waynesboro, VA 22980 and is currently estimated at $388,625, approximately $232 per square foot. 60 Pheasant Run is a home located in Augusta County with nearby schools including Stuarts Draft Elementary School, Stuarts Draft Middle School, and Stuarts Draft High School.
Ownership History
Date
Name
Owned For
Owner Type
Purchase Details
Closed on
Oct 25, 2017
Sold by
Rankin Paul G and Rankin Judith A
Bought by
Miller Gregory L and Miller Romona M
Current Estimated Value
Home Financials for this Owner
Home Financials are based on the most recent Mortgage that was taken out on this home.
Original Mortgage
$200,000
Outstanding Balance
$167,101
Interest Rate
3.83%
Mortgage Type
New Conventional
Estimated Equity
$221,524
Purchase Details
Closed on
Nov 18, 2016
Sold by
Polly Susan Macgregor and Cook Nancy Macgregor
Bought by
Shifflett Larry F and Shifflett Katie R
Home Financials for this Owner
Home Financials are based on the most recent Mortgage that was taken out on this home.
Original Mortgage
$192,000
Interest Rate
3.47%
Mortgage Type
Farmers Home Administration
Create a Home Valuation Report for This Property
The Home Valuation Report is an in-depth analysis detailing your home's value as well as a comparison with similar homes in the area
Home Values in the Area
Average Home Value in this Area
Purchase History
| Date | Buyer | Sale Price | Title Company |
|---|---|---|---|
| Miller Gregory L | $225,000 | None Available | |
| Shifflett Larry F | $240,000 | Vs Title |
Source: Public Records
Mortgage History
| Date | Status | Borrower | Loan Amount |
|---|---|---|---|
| Open | Miller Gregory L | $200,000 | |
| Previous Owner | Shifflett Larry F | $192,000 |
Source: Public Records
Tax History Compared to Growth
Tax History
| Year | Tax Paid | Tax Assessment Tax Assessment Total Assessment is a certain percentage of the fair market value that is determined by local assessors to be the total taxable value of land and additions on the property. | Land | Improvement |
|---|---|---|---|---|
| 2025 | $1,724 | $331,500 | $65,000 | $266,500 |
| 2024 | $1,749 | $336,400 | $65,000 | $271,400 |
| 2023 | $1,387 | $220,200 | $60,000 | $160,200 |
| 2022 | $1,387 | $220,200 | $60,000 | $160,200 |
| 2021 | $1,387 | $220,200 | $60,000 | $160,200 |
| 2020 | $1,387 | $220,200 | $60,000 | $160,200 |
| 2019 | $1,387 | $220,200 | $60,000 | $160,200 |
| 2018 | $1,266 | $200,896 | $60,000 | $140,896 |
| 2017 | $1,165 | $200,896 | $60,000 | $140,896 |
| 2016 | $1,165 | $200,896 | $60,000 | $140,896 |
| 2015 | $996 | $200,896 | $60,000 | $140,896 |
| 2014 | $996 | $200,896 | $60,000 | $140,896 |
| 2013 | $996 | $207,400 | $55,000 | $152,400 |
Source: Public Records
Map
Nearby Homes
- 76 Pheasant Run
- 48 Meadow Ridge Rd
- 30 Sir Robin Rd
- 1007 Ladd Rd
- 120 Camden Coyner Ln
- 128 Camden Coyner Ln
- 124 Camden Coyner Ln
- 257 Camden Coyner Ln
- 253 Camden Coyner Ln
- 249 Camden Coyner Ln
- 232 Camden Coyner Ln
- 260 Camden Coyner Ln
- 256 Camden Coyner Ln
- 252 Camden Coyner Ln
- 248 Camden Coyner Ln
- 244 Camden Coyner Ln
- 240 Camden Coyner Ln
- 236 Camden Coyner Ln
- 228 Camden Coyner Ln
- 850 Shenandoah Village Dr
- 52 Pheasant Run
- 68 Pheasant Run
- 53 Whippoorwill Cove
- 44 Pheasant Run
- 59 Pheasant Run
- 24 Pheasant Run
- 65 Pheasant Run
- 51 Pheasant Run
- 59 Whippoorwill Cove
- 73 Pheasant Run
- 49 Whippoorwill Cove
- 45 Pheasant Run
- 83 Pheasant Run
- 56 Whippoorwill Cove
- 60 Whippoorwill Cove
- 48 Whippoorwill Cove
- 25 Pheasant Run
- 35 Pheasant Run
- 17 Pheasant Run
- 94 Pheasant Run