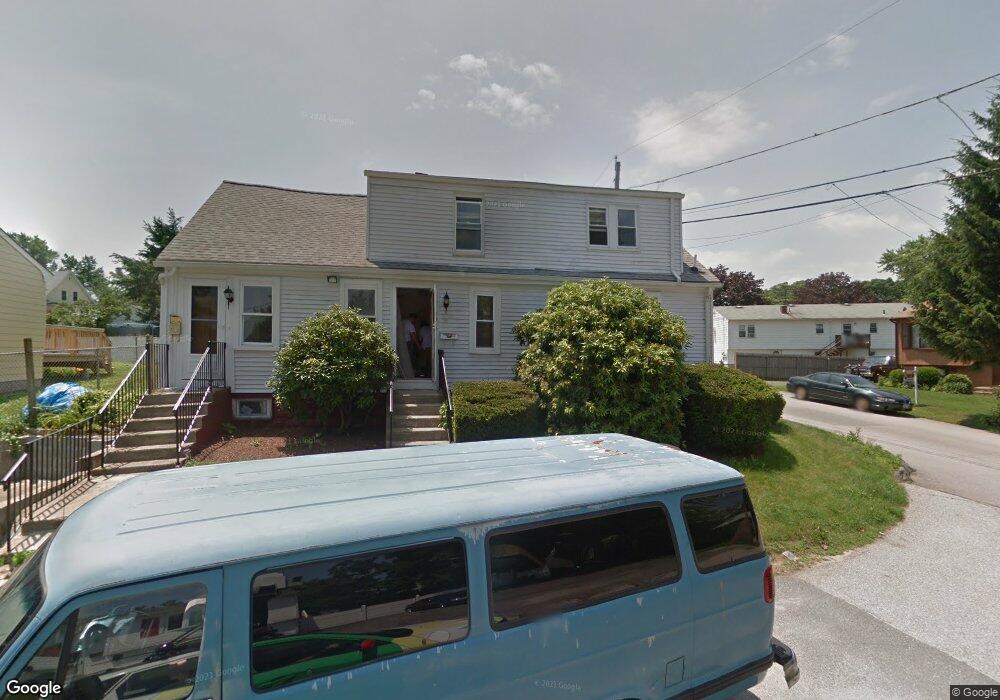
60 Pleasant View Ave Johnston, RI 02919
Killingly Street NeighborhoodEstimated Value: $364,327 - $467,000
4
Beds
2
Baths
3,690
Sq Ft
$114/Sq Ft
Est. Value
About This Home
This home is located at 60 Pleasant View Ave, Johnston, RI 02919 and is currently estimated at $418,832, approximately $113 per square foot. 60 Pleasant View Ave is a home located in Providence County with nearby schools including Johnston Senior High School and Mount Pleasant Academy.
Ownership History
Date
Name
Owned For
Owner Type
Purchase Details
Closed on
Dec 22, 2011
Sold by
Reservoir Ventures 2 L
Bought by
Johnson Facia
Current Estimated Value
Purchase Details
Closed on
Feb 1, 2011
Sold by
Fnma
Bought by
Reservoir Ventures 2 L
Home Financials for this Owner
Home Financials are based on the most recent Mortgage that was taken out on this home.
Original Mortgage
$54,100
Interest Rate
4.83%
Mortgage Type
Purchase Money Mortgage
Purchase Details
Closed on
Jul 27, 2010
Sold by
King Michael F
Bought by
Federal National Mortgage Association
Purchase Details
Closed on
Jul 31, 1989
Sold by
Equity Devel Inc
Bought by
King Michael F
Create a Home Valuation Report for This Property
The Home Valuation Report is an in-depth analysis detailing your home's value as well as a comparison with similar homes in the area
Home Values in the Area
Average Home Value in this Area
Purchase History
| Date | Buyer | Sale Price | Title Company |
|---|---|---|---|
| Johnson Facia | $98,000 | -- | |
| Johnson Facia | $98,000 | -- | |
| Reservoir Ventures 2 L | $50,000 | -- | |
| Reservoir Ventures 2 L | $50,000 | -- | |
| Federal National Mortgage Association | $328,808 | -- | |
| Federal National Mortgage Association | $328,808 | -- | |
| King Michael F | $114,000 | -- |
Source: Public Records
Mortgage History
| Date | Status | Borrower | Loan Amount |
|---|---|---|---|
| Previous Owner | King Michael F | $54,100 |
Source: Public Records
Tax History
| Year | Tax Paid | Tax Assessment Tax Assessment Total Assessment is a certain percentage of the fair market value that is determined by local assessors to be the total taxable value of land and additions on the property. | Land | Improvement |
|---|---|---|---|---|
| 2025 | $4,392 | $281,200 | $72,900 | $208,300 |
| 2024 | $4,302 | $281,200 | $72,900 | $208,300 |
| 2023 | $4,302 | $281,200 | $72,900 | $208,300 |
| 2022 | $3,883 | $167,100 | $54,000 | $113,100 |
| 2021 | $3,883 | $167,100 | $54,000 | $113,100 |
| 2018 | $3,557 | $129,400 | $40,200 | $89,200 |
| 2016 | $4,706 | $129,400 | $40,200 | $89,200 |
| 2015 | $3,621 | $124,900 | $40,600 | $84,300 |
| 2014 | $3,591 | $124,900 | $40,600 | $84,300 |
| 2013 | $3,591 | $124,900 | $40,600 | $84,300 |
Source: Public Records
Map
Nearby Homes
Your Personal Tour Guide
Ask me questions while you tour the home.