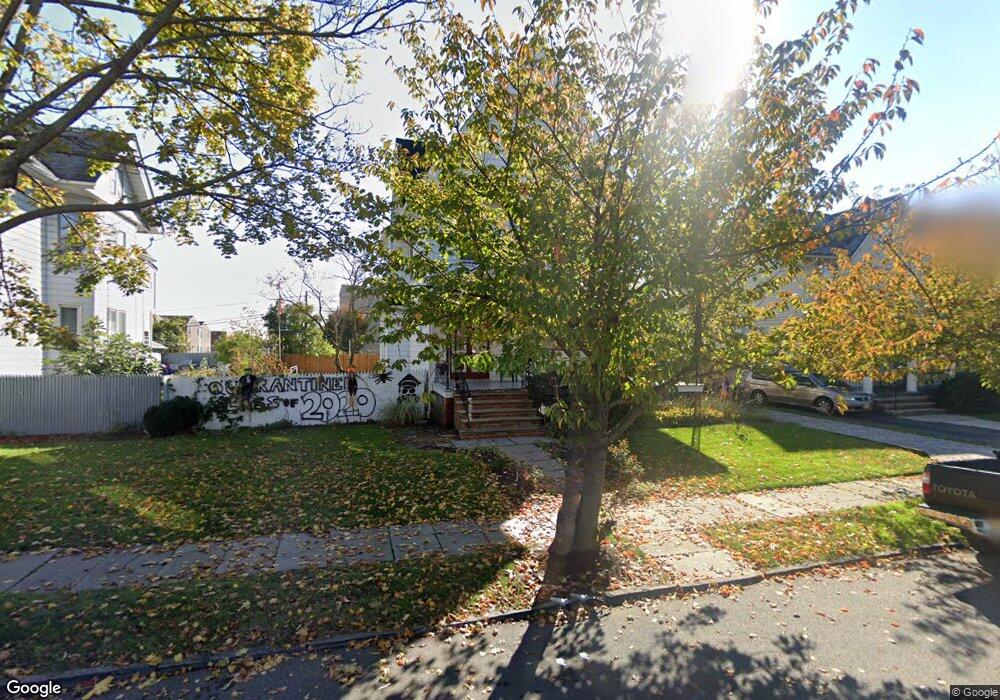
60 Ridge St Unit 62 Orange, NJ 07050
Estimated Value: $553,000 - $678,000
--
Bed
--
Bath
2,279
Sq Ft
$262/Sq Ft
Est. Value
About This Home
This home is located at 60 Ridge St Unit 62, Orange, NJ 07050 and is currently estimated at $597,384, approximately $262 per square foot. 60 Ridge St Unit 62 is a home located in Essex County with nearby schools including East Orange Community Charter School.
Ownership History
Date
Name
Owned For
Owner Type
Purchase Details
Closed on
Jul 25, 2005
Sold by
Ricciardelli Frank
Bought by
Martinez Evelio and Martinez Susan
Current Estimated Value
Home Financials for this Owner
Home Financials are based on the most recent Mortgage that was taken out on this home.
Original Mortgage
$240,000
Outstanding Balance
$125,283
Interest Rate
5.66%
Estimated Equity
$472,101
Purchase Details
Closed on
Jul 31, 2002
Sold by
Colagrande John
Bought by
Ricciardelli Frank
Create a Home Valuation Report for This Property
The Home Valuation Report is an in-depth analysis detailing your home's value as well as a comparison with similar homes in the area
Home Values in the Area
Average Home Value in this Area
Purchase History
| Date | Buyer | Sale Price | Title Company |
|---|---|---|---|
| Martinez Evelio | $300,000 | -- | |
| Ricciardelli Frank | $150,000 | -- |
Source: Public Records
Mortgage History
| Date | Status | Borrower | Loan Amount |
|---|---|---|---|
| Open | Martinez Evelio | $240,000 |
Source: Public Records
Tax History Compared to Growth
Tax History
| Year | Tax Paid | Tax Assessment Tax Assessment Total Assessment is a certain percentage of the fair market value that is determined by local assessors to be the total taxable value of land and additions on the property. | Land | Improvement |
|---|---|---|---|---|
| 2025 | $15,098 | $405,100 | $134,900 | $270,200 |
| 2024 | $15,098 | $405,100 | $134,900 | $270,200 |
| 2022 | $14,041 | $405,100 | $134,900 | $270,200 |
| 2021 | $13,155 | $227,600 | $89,800 | $137,800 |
| 2020 | $12,762 | $227,600 | $89,800 | $137,800 |
| 2019 | $12,097 | $227,600 | $89,800 | $137,800 |
| 2018 | $11,903 | $227,600 | $89,800 | $137,800 |
| 2017 | $11,084 | $227,600 | $89,800 | $137,800 |
| 2016 | $10,875 | $227,600 | $89,800 | $137,800 |
| 2015 | $10,590 | $227,600 | $89,800 | $137,800 |
| 2014 | $10,126 | $227,600 | $89,800 | $137,800 |
Source: Public Records
Map
Nearby Homes