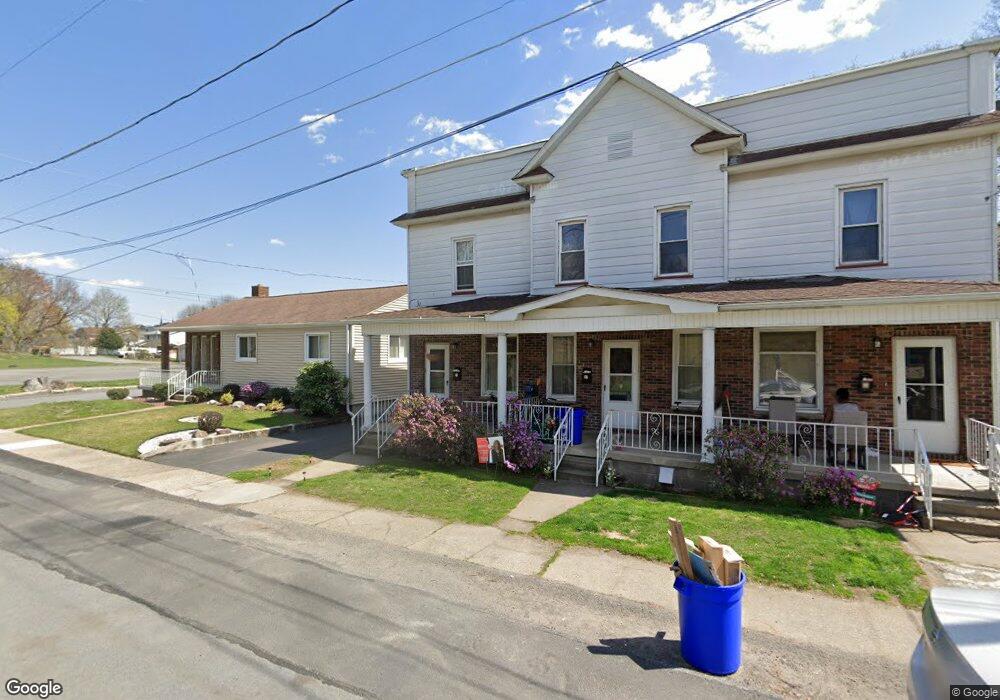
60 River St Pittston, PA 18640
Estimated Value: $204,826 - $296,000
--
Bed
--
Bath
3,669
Sq Ft
$71/Sq Ft
Est. Value
About This Home
This home is located at 60 River St, Pittston, PA 18640 and is currently estimated at $259,707, approximately $70 per square foot. 60 River St is a home located in Luzerne County with nearby schools including Pittston City Intermediate Center, Pittston Area Middle School, and Pittston Area Senior High School.
Ownership History
Date
Name
Owned For
Owner Type
Purchase Details
Closed on
Apr 17, 2019
Sold by
60 62 64 River Llc
Bought by
Ferrante John and Rinaldi Lou
Current Estimated Value
Home Financials for this Owner
Home Financials are based on the most recent Mortgage that was taken out on this home.
Original Mortgage
$93,750
Outstanding Balance
$82,589
Interest Rate
4.4%
Mortgage Type
New Conventional
Estimated Equity
$177,118
Purchase Details
Closed on
Sep 18, 2018
Sold by
Midfjrst Bank
Bought by
60 62 64 River Llc
Home Financials for this Owner
Home Financials are based on the most recent Mortgage that was taken out on this home.
Original Mortgage
$73,500
Interest Rate
4.5%
Mortgage Type
Commercial
Purchase Details
Closed on
Jul 5, 2017
Sold by
Gaydos Jonathan D
Bought by
Midfirst Bank
Purchase Details
Closed on
Aug 19, 2005
Sold by
Crossmon James D and Muscavage Amanda J
Bought by
Crossmon James D
Create a Home Valuation Report for This Property
The Home Valuation Report is an in-depth analysis detailing your home's value as well as a comparison with similar homes in the area
Home Values in the Area
Average Home Value in this Area
Purchase History
| Date | Buyer | Sale Price | Title Company |
|---|---|---|---|
| Ferrante John | $125,000 | United Shore Fincl Svcs Llc | |
| 60 62 64 River Llc | $64,000 | Entitle Insurance Company | |
| Midfirst Bank | $1,601 | None Available | |
| Crossmon James D | -- | None Available |
Source: Public Records
Mortgage History
| Date | Status | Borrower | Loan Amount |
|---|---|---|---|
| Open | Ferrante John | $93,750 | |
| Previous Owner | 60 62 64 River Llc | $73,500 |
Source: Public Records
Tax History Compared to Growth
Tax History
| Year | Tax Paid | Tax Assessment Tax Assessment Total Assessment is a certain percentage of the fair market value that is determined by local assessors to be the total taxable value of land and additions on the property. | Land | Improvement |
|---|---|---|---|---|
| 2025 | $3,656 | $122,900 | $25,000 | $97,900 |
| 2024 | $3,656 | $122,900 | $25,000 | $97,900 |
| 2023 | $3,656 | $122,900 | $25,000 | $97,900 |
| 2022 | $3,633 | $122,900 | $25,000 | $97,900 |
| 2021 | $3,633 | $122,900 | $25,000 | $97,900 |
| 2020 | $3,564 | $122,900 | $25,000 | $97,900 |
| 2019 | $3,540 | $122,900 | $25,000 | $97,900 |
| 2018 | $3,480 | $122,900 | $25,000 | $97,900 |
| 2017 | $3,417 | $122,900 | $25,000 | $97,900 |
| 2016 | -- | $122,900 | $25,000 | $97,900 |
| 2015 | $2,097 | $122,900 | $25,000 | $97,900 |
| 2014 | $2,097 | $122,900 | $25,000 | $97,900 |
Source: Public Records
Map
Nearby Homes