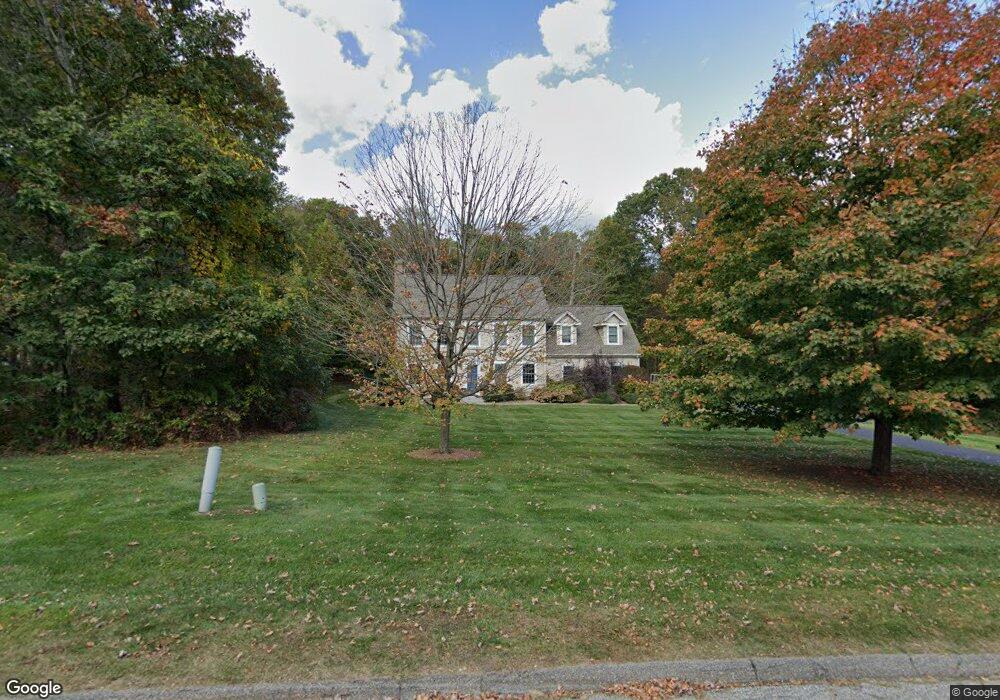
60 Saffron Ln East Hampton, CT 06424
Estimated Value: $560,000 - $626,000
3
Beds
3
Baths
2,334
Sq Ft
$248/Sq Ft
Est. Value
About This Home
This home is located at 60 Saffron Ln, East Hampton, CT 06424 and is currently estimated at $579,436, approximately $248 per square foot. 60 Saffron Ln is a home located in Middlesex County with nearby schools including Memorial School, Center Elementary School, and East Hampton Middle School.
Ownership History
Date
Name
Owned For
Owner Type
Purchase Details
Closed on
Mar 27, 2003
Sold by
Goldner Jennifer L and Goldner Mark A
Bought by
Cahoon Jeffrey R and Derosa Susan L
Current Estimated Value
Home Financials for this Owner
Home Financials are based on the most recent Mortgage that was taken out on this home.
Original Mortgage
$225,000
Outstanding Balance
$97,793
Interest Rate
5.91%
Estimated Equity
$481,643
Purchase Details
Closed on
Jul 11, 2002
Sold by
Champion Hl Est Llc
Bought by
Brian Flanry Bldrs Llc
Home Financials for this Owner
Home Financials are based on the most recent Mortgage that was taken out on this home.
Original Mortgage
$62,600
Interest Rate
12%
Create a Home Valuation Report for This Property
The Home Valuation Report is an in-depth analysis detailing your home's value as well as a comparison with similar homes in the area
Home Values in the Area
Average Home Value in this Area
Purchase History
| Date | Buyer | Sale Price | Title Company |
|---|---|---|---|
| Cahoon Jeffrey R | $330,000 | -- | |
| Cahoon Jeffrey R | $330,000 | -- | |
| Brian Flanry Bldrs Llc | $129,000 | -- | |
| Brian Flanry Bldrs Llc | $129,000 | -- |
Source: Public Records
Mortgage History
| Date | Status | Borrower | Loan Amount |
|---|---|---|---|
| Open | Brian Flanry Bldrs Llc | $225,000 | |
| Closed | Brian Flanry Bldrs Llc | $225,000 | |
| Previous Owner | Brian Flanry Bldrs Llc | $62,600 |
Source: Public Records
Tax History Compared to Growth
Tax History
| Year | Tax Paid | Tax Assessment Tax Assessment Total Assessment is a certain percentage of the fair market value that is determined by local assessors to be the total taxable value of land and additions on the property. | Land | Improvement |
|---|---|---|---|---|
| 2025 | $9,037 | $227,580 | $64,620 | $162,960 |
| 2024 | $8,657 | $227,580 | $64,620 | $162,960 |
| 2023 | $8,207 | $227,580 | $64,620 | $162,960 |
| 2022 | $7,888 | $227,580 | $64,620 | $162,960 |
| 2021 | $7,858 | $227,580 | $64,620 | $162,960 |
| 2020 | $7,627 | $230,140 | $63,510 | $166,630 |
| 2019 | $7,806 | $235,560 | $67,970 | $167,590 |
| 2018 | $7,378 | $235,560 | $67,970 | $167,590 |
| 2017 | $7,378 | $235,560 | $67,970 | $167,590 |
| 2016 | $6,935 | $235,560 | $67,970 | $167,590 |
| 2015 | $7,215 | $259,710 | $89,970 | $169,740 |
| 2014 | $6,277 | $259,710 | $89,970 | $169,740 |
Source: Public Records
Map
Nearby Homes