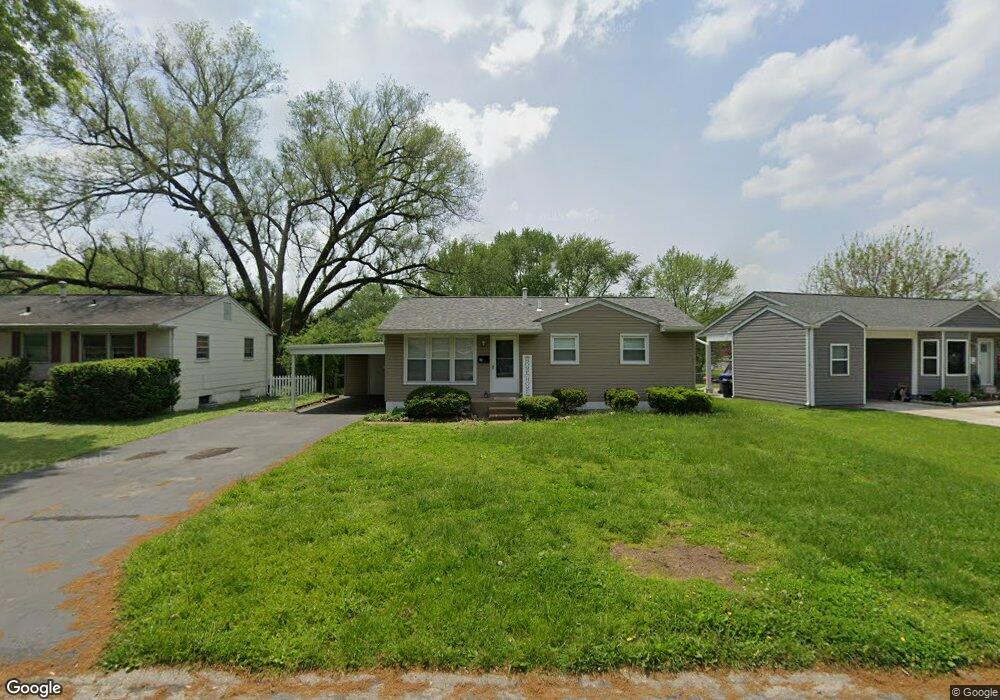
60 Saint Albert Ln Florissant, MO 63031
Estimated Value: $139,000 - $157,000
3
Beds
2
Baths
890
Sq Ft
$166/Sq Ft
Est. Value
About This Home
This home is located at 60 Saint Albert Ln, Florissant, MO 63031 and is currently estimated at $147,507, approximately $165 per square foot. 60 Saint Albert Ln is a home located in St. Louis County with nearby schools including Combs Elementary School, Cross Keys Middle School, and McCluer North High School.
Ownership History
Date
Name
Owned For
Owner Type
Purchase Details
Closed on
Aug 22, 2024
Sold by
Tikc Bravo Llc
Bought by
Vb Ten Llc
Current Estimated Value
Home Financials for this Owner
Home Financials are based on the most recent Mortgage that was taken out on this home.
Original Mortgage
$171,567,288
Outstanding Balance
$139,144,755
Interest Rate
6.77%
Mortgage Type
Credit Line Revolving
Estimated Equity
-$138,997,248
Purchase Details
Closed on
Feb 29, 2012
Sold by
Pastor Kevin J and Pastor Barrett H
Bought by
Golden Key Road Llc
Purchase Details
Closed on
Dec 21, 2005
Sold by
Rjm Investment Development Corp
Bought by
Paige Properties Lc
Purchase Details
Closed on
Mar 24, 2004
Sold by
Ridgemoor Properties Inc
Bought by
Investment Rjm
Home Financials for this Owner
Home Financials are based on the most recent Mortgage that was taken out on this home.
Original Mortgage
$84,000
Interest Rate
5.81%
Mortgage Type
Purchase Money Mortgage
Create a Home Valuation Report for This Property
The Home Valuation Report is an in-depth analysis detailing your home's value as well as a comparison with similar homes in the area
Home Values in the Area
Average Home Value in this Area
Purchase History
| Date | Buyer | Sale Price | Title Company |
|---|---|---|---|
| Vb Ten Llc | -- | Os National | |
| Vb Ten Llc | -- | Os National | |
| Golden Key Road Llc | $570,000 | Ort | |
| Paige Properties Lc | $88,000 | Archway Title Agency Inc | |
| Investment Rjm | $68,500 | -- | |
| Ridgemoor Properties Inc | $60,100 | -- |
Source: Public Records
Mortgage History
| Date | Status | Borrower | Loan Amount |
|---|---|---|---|
| Open | Vb Ten Llc | $171,567,288 | |
| Closed | Vb Ten Llc | $171,567,288 | |
| Previous Owner | Investment Rjm | $84,000 |
Source: Public Records
Tax History Compared to Growth
Tax History
| Year | Tax Paid | Tax Assessment Tax Assessment Total Assessment is a certain percentage of the fair market value that is determined by local assessors to be the total taxable value of land and additions on the property. | Land | Improvement |
|---|---|---|---|---|
| 2025 | $1,784 | $25,670 | $4,410 | $21,260 |
| 2024 | $1,778 | $22,900 | $3,040 | $19,860 |
| 2023 | $1,778 | $22,900 | $3,040 | $19,860 |
| 2022 | $1,505 | $16,970 | $4,410 | $12,560 |
| 2021 | $1,480 | $16,970 | $4,410 | $12,560 |
| 2020 | $1,336 | $14,450 | $3,900 | $10,550 |
| 2019 | $1,310 | $14,450 | $3,900 | $10,550 |
| 2018 | $1,418 | $14,000 | $2,110 | $11,890 |
| 2017 | $1,411 | $14,000 | $2,110 | $11,890 |
| 2016 | $1,653 | $16,030 | $3,910 | $12,120 |
| 2015 | $1,662 | $16,030 | $3,910 | $12,120 |
| 2014 | $1,487 | $14,780 | $3,740 | $11,040 |
Source: Public Records
Map
Nearby Homes
- 279 Elmdale Ct
- 216 Graham Rd
- 630 Graham Rd
- 540 S Jefferson St
- 305 S Lafayette St
- 580 Saint Marie St
- 260 N Jefferson St
- 175 Clark St
- 201 Brower Ln
- 937 Cades Cove
- 15 Henson Ln
- 940 Harrison St
- 7731 Hazelcrest Dr Unit H
- 200 Calbreath Ct
- 7641 Hazelcrest Dr Unit 47
- 7594 Hazelcrest Dr Unit B
- 215 Maple Dr
- 270 W Saint Anthony Ln
- 7520 Hazelcrest Dr Unit 227
- 1110 Saint Bernadette Ln
- 60 St Albert Ln
- 50 Saint Albert Ln
- 70 Saint Albert Ln
- 40 Saint Albert Ln
- 80 Saint Albert Ln
- 30 Saint Albert Ln
- 65 Saint Albert Ln
- 90 Saint Albert Ln
- 55 St Alice Ln
- 75 Saint Albert Ln
- 85 Saint Albert Ln
- 95 Saint Albert Ln
- 45 Saint Alice Ln
- 55 Saint Alice Ln
- 75 Saint Alice Ln
- 65 Saint Alice Ln
- 35 Saint Alice Ln
- 345 S Saint Jacques St
- 365 S Saint Jacques St
- 325 S Saint Jacques St