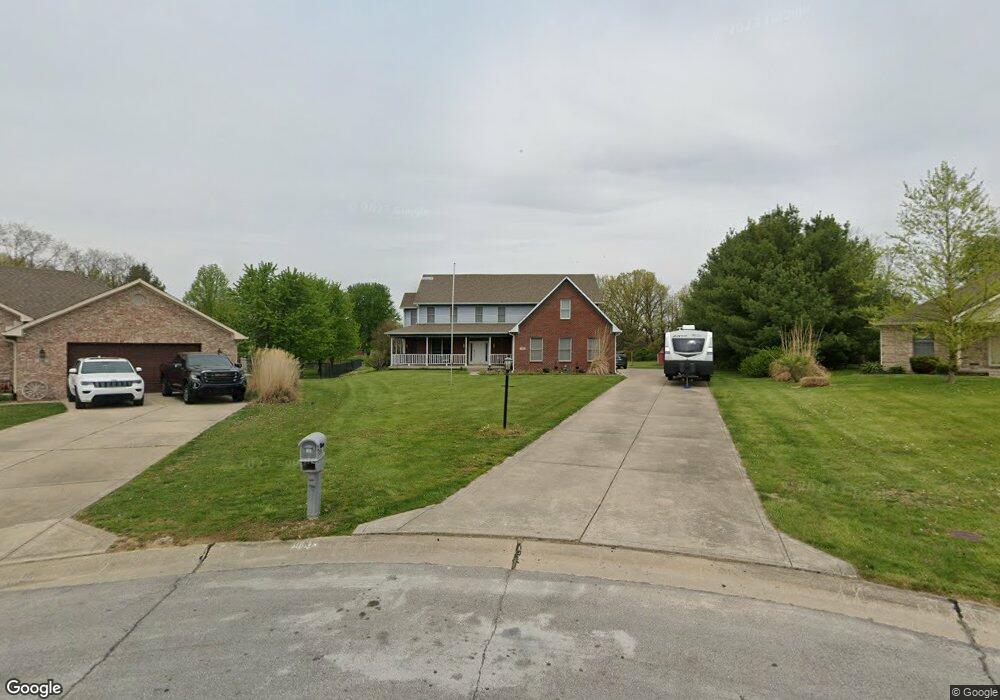
60 Sara Ct Whiteland, IN 46184
Estimated Value: $486,000 - $529,178
4
Beds
3
Baths
3,402
Sq Ft
$149/Sq Ft
Est. Value
About This Home
This home is located at 60 Sara Ct, Whiteland, IN 46184 and is currently estimated at $507,795, approximately $149 per square foot. 60 Sara Ct is a home located in Johnson County with nearby schools including Whiteland Elementary School, Clark-Pleasant Middle School, and Whiteland Community High School.
Ownership History
Date
Name
Owned For
Owner Type
Purchase Details
Closed on
Oct 23, 2023
Sold by
Powers Emily D
Bought by
Toler Emily D
Current Estimated Value
Purchase Details
Closed on
Sep 17, 2012
Sold by
Powers Shawn M
Bought by
Powers Emily D
Purchase Details
Closed on
Apr 19, 2010
Sold by
Mccorkle Barbara J
Bought by
Powers Shawn M and Powers Emily D
Home Financials for this Owner
Home Financials are based on the most recent Mortgage that was taken out on this home.
Original Mortgage
$265,109
Interest Rate
4.75%
Mortgage Type
FHA
Create a Home Valuation Report for This Property
The Home Valuation Report is an in-depth analysis detailing your home's value as well as a comparison with similar homes in the area
Home Values in the Area
Average Home Value in this Area
Purchase History
| Date | Buyer | Sale Price | Title Company |
|---|---|---|---|
| Toler Emily D | -- | None Listed On Document | |
| Powers Emily D | -- | None Available | |
| Powers Shawn M | -- | None Available |
Source: Public Records
Mortgage History
| Date | Status | Borrower | Loan Amount |
|---|---|---|---|
| Previous Owner | Powers Shawn M | $265,109 |
Source: Public Records
Tax History Compared to Growth
Tax History
| Year | Tax Paid | Tax Assessment Tax Assessment Total Assessment is a certain percentage of the fair market value that is determined by local assessors to be the total taxable value of land and additions on the property. | Land | Improvement |
|---|---|---|---|---|
| 2025 | $4,657 | $448,700 | $68,200 | $380,500 |
| 2024 | $4,657 | $440,600 | $68,200 | $372,400 |
| 2023 | $4,921 | $447,100 | $68,200 | $378,900 |
| 2022 | $4,119 | $376,300 | $67,900 | $308,400 |
| 2021 | $3,372 | $304,200 | $49,300 | $254,900 |
| 2020 | $3,380 | $297,700 | $49,300 | $248,400 |
| 2019 | $3,376 | $297,100 | $49,300 | $247,800 |
| 2018 | $3,273 | $282,200 | $45,900 | $236,300 |
| 2017 | $3,269 | $294,200 | $45,900 | $248,300 |
| 2016 | $3,121 | $272,100 | $45,900 | $226,200 |
| 2014 | $2,805 | $239,300 | $47,100 | $192,200 |
| 2013 | $2,805 | $241,800 | $47,100 | $194,700 |
Source: Public Records
Map
Nearby Homes
- 241 Deborah Ln
- 8 Marys Ct
- 800 Beechwood Ct
- 818 Beechwood Ct
- 1139 Beechwood Ct
- 836 Beechwood Ct
- 1047 Beechwood Ct
- 807 Beechwood Ct
- 752 Beechwood Ct
- 899 Beechwood Ct
- 835 Beechwood Ct
- 867 Beechwood Ct
- 1521 Cottonwood Dr
- 4058 Knollwood Ave
- 4195 Knollwood Ct
- 4128 William Ave
- 3930 Sarasota Dr
- 254 Halldale Dr
- 83 Palmetto Dr
- 372 Wert Ln
- 50 Sara Ct
- 61 Sara Ct
- 4016 Fairoaks Dr
- 40 Sara Ct
- 4102 Fairoaks Dr
- 4016 Fairoaks Dr
- 4084 Fairoaks Dr
- 51 Sara Ct
- 4114 Fairoaks Dr
- 4080 Fairoaks Dr
- 341 Park Forest Dr E
- 331 Park Forest Dr E
- 349 Park Forest Dr E
- 321 Park Forest Dr E
- 4076 Fairoaks Dr
- 4128 Fairoaks Dr
- 41 Sara Ct
- 4087 Fairoaks Dr
- 351 Park Forest Dr E
- 20 Sara Ct