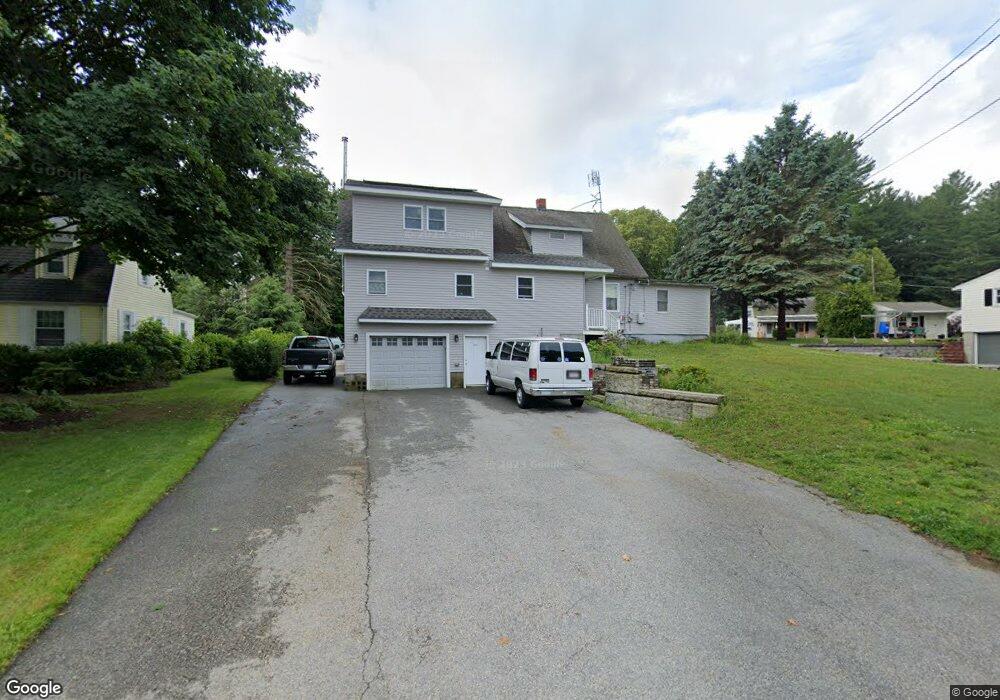
60 School St Auburn, MA 01501
Downtown Auburn NeighborhoodEstimated Value: $543,000 - $632,000
4
Beds
4
Baths
2,921
Sq Ft
$205/Sq Ft
Est. Value
About This Home
This home is located at 60 School St, Auburn, MA 01501 and is currently estimated at $599,102, approximately $205 per square foot. 60 School St is a home located in Worcester County with nearby schools including Auburn Senior High School and Shrewsbury Montessori School - Auburn Campus.
Ownership History
Date
Name
Owned For
Owner Type
Purchase Details
Closed on
Oct 18, 1996
Sold by
Orcutt Frederick and Orcutt June M
Bought by
Orcutt Alberta F
Current Estimated Value
Home Financials for this Owner
Home Financials are based on the most recent Mortgage that was taken out on this home.
Original Mortgage
$80,250
Outstanding Balance
$7,480
Interest Rate
8.26%
Mortgage Type
Purchase Money Mortgage
Estimated Equity
$591,622
Create a Home Valuation Report for This Property
The Home Valuation Report is an in-depth analysis detailing your home's value as well as a comparison with similar homes in the area
Home Values in the Area
Average Home Value in this Area
Purchase History
| Date | Buyer | Sale Price | Title Company |
|---|---|---|---|
| Orcutt Alberta F | $80,000 | -- |
Source: Public Records
Mortgage History
| Date | Status | Borrower | Loan Amount |
|---|---|---|---|
| Open | Orcutt Alberta F | $80,250 |
Source: Public Records
Tax History Compared to Growth
Tax History
| Year | Tax Paid | Tax Assessment Tax Assessment Total Assessment is a certain percentage of the fair market value that is determined by local assessors to be the total taxable value of land and additions on the property. | Land | Improvement |
|---|---|---|---|---|
| 2025 | $66 | $460,000 | $109,900 | $350,100 |
| 2024 | $6,492 | $434,800 | $105,100 | $329,700 |
| 2023 | $5,720 | $360,200 | $95,600 | $264,600 |
| 2022 | $5,342 | $317,600 | $95,600 | $222,000 |
| 2021 | $4,985 | $274,800 | $84,400 | $190,400 |
| 2020 | $4,166 | $231,700 | $84,400 | $147,300 |
| 2019 | $3,212 | $174,400 | $79,200 | $95,200 |
| 2018 | $3,028 | $164,200 | $74,000 | $90,200 |
| 2017 | $2,863 | $156,100 | $67,200 | $88,900 |
| 2016 | $2,818 | $155,800 | $69,900 | $85,900 |
| 2015 | $2,815 | $163,100 | $69,900 | $93,200 |
| 2014 | $2,618 | $151,400 | $66,600 | $84,800 |
Source: Public Records
Map
Nearby Homes