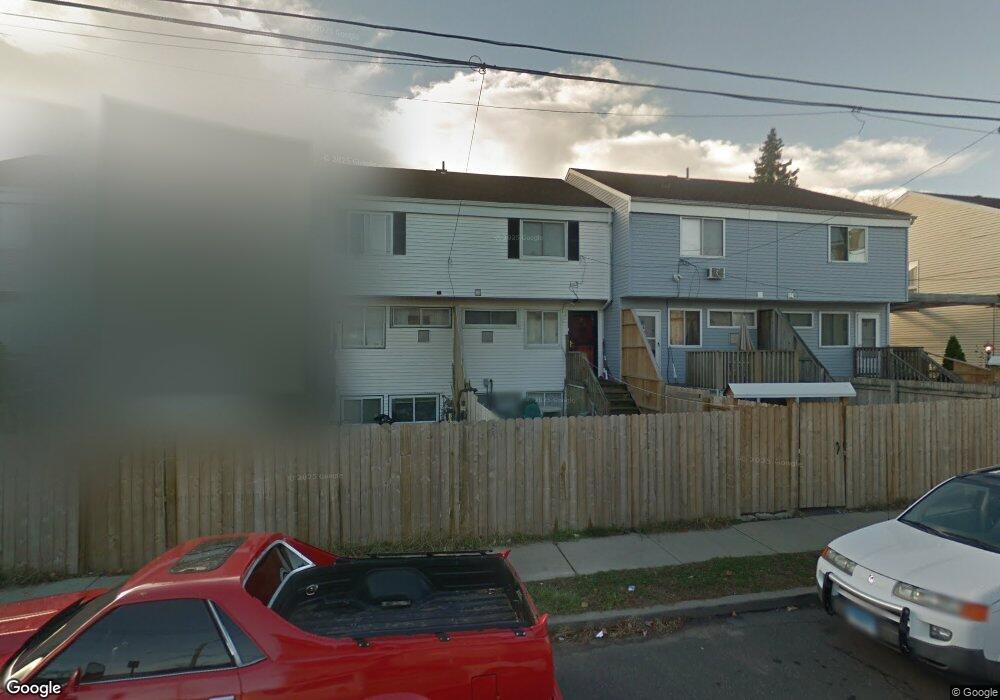
60 Sherman St Bridgeport, CT 06608
East Side Bridgeport NeighborhoodEstimated Value: $166,784 - $231,000
2
Beds
2
Baths
980
Sq Ft
$194/Sq Ft
Est. Value
About This Home
This home is located at 60 Sherman St, Bridgeport, CT 06608 and is currently estimated at $190,196, approximately $194 per square foot. 60 Sherman St is a home located in Fairfield County with nearby schools including Waltersville School, Harding High School, and Capital Prep Harbor Upper School.
Ownership History
Date
Name
Owned For
Owner Type
Purchase Details
Closed on
Sep 24, 2018
Sold by
Wooster 81 Llc
Bought by
Fairfield Cnty Homebuy
Current Estimated Value
Home Financials for this Owner
Home Financials are based on the most recent Mortgage that was taken out on this home.
Original Mortgage
$79,500
Outstanding Balance
$69,186
Interest Rate
4.5%
Mortgage Type
Credit Line Revolving
Estimated Equity
$121,010
Purchase Details
Closed on
Jan 31, 2018
Sold by
Ndzi Desmond
Bought by
Wooster 81 Llc
Purchase Details
Closed on
Jan 17, 2017
Sold by
Powell Robbin
Bought by
Ndzi Desmond
Purchase Details
Closed on
Aug 20, 2012
Sold by
Powell Robin
Bought by
Powell Robbin
Purchase Details
Closed on
Mar 28, 2011
Sold by
Peterson Ella Est
Bought by
Powell Robbin E
Create a Home Valuation Report for This Property
The Home Valuation Report is an in-depth analysis detailing your home's value as well as a comparison with similar homes in the area
Home Values in the Area
Average Home Value in this Area
Purchase History
| Date | Buyer | Sale Price | Title Company |
|---|---|---|---|
| Fairfield Cnty Homebuy | -- | -- | |
| Fairfield Cnty Homebuy | -- | -- | |
| Wooster 81 Llc | -- | -- | |
| Wooster 81 Llc | -- | -- | |
| Ndzi Desmond | $46,500 | -- | |
| Ndzi Desmond | $46,500 | -- | |
| Powell Robbin | -- | -- | |
| Powell Robbin | -- | -- | |
| Powell Robbin E | $40,000 | -- | |
| Powell Robbin E | $40,000 | -- |
Source: Public Records
Mortgage History
| Date | Status | Borrower | Loan Amount |
|---|---|---|---|
| Open | Powell Robbin E | $79,500 | |
| Previous Owner | Powell Robbin E | $182,139 |
Source: Public Records
Tax History Compared to Growth
Tax History
| Year | Tax Paid | Tax Assessment Tax Assessment Total Assessment is a certain percentage of the fair market value that is determined by local assessors to be the total taxable value of land and additions on the property. | Land | Improvement |
|---|---|---|---|---|
| 2025 | $2,146 | $49,400 | $0 | $49,400 |
| 2024 | $2,146 | $49,400 | $0 | $49,400 |
| 2023 | $2,146 | $49,400 | $0 | $49,400 |
| 2022 | $2,146 | $49,400 | $0 | $49,400 |
| 2021 | $2,146 | $49,400 | $0 | $49,400 |
| 2020 | $2,274 | $42,120 | $0 | $42,120 |
| 2019 | $2,274 | $42,120 | $0 | $42,120 |
| 2018 | $2,290 | $42,120 | $0 | $42,120 |
| 2017 | $2,290 | $42,120 | $0 | $42,120 |
| 2016 | $2,290 | $42,120 | $0 | $42,120 |
| 2015 | $2,893 | $68,550 | $0 | $68,550 |
| 2014 | $2,893 | $68,550 | $0 | $68,550 |
Source: Public Records
Map
Nearby Homes
- 249 Hough Ave Unit 251
- 509 Pembroke St
- 445 Nichols St
- 60 Gilmore St
- 691 E Main St
- 520 Seaview Ave
- 180 Holly St
- 704 Maple St
- 247 6th St
- 746 Maple St
- 800 Seaview Ave Unit 790-3
- 696 Kossuth St Unit 698
- 40 5th St
- 228 Holly St Unit 230
- 79 William St
- 221 Bunnell St
- 147 Helen St Unit 149
- 93 Clifford St
- 54 6th St
- 49 Bunnell St Unit 51