Estimated Value: $376,000 - $420,000
2
Beds
2
Baths
1,370
Sq Ft
$294/Sq Ft
Est. Value
About This Home
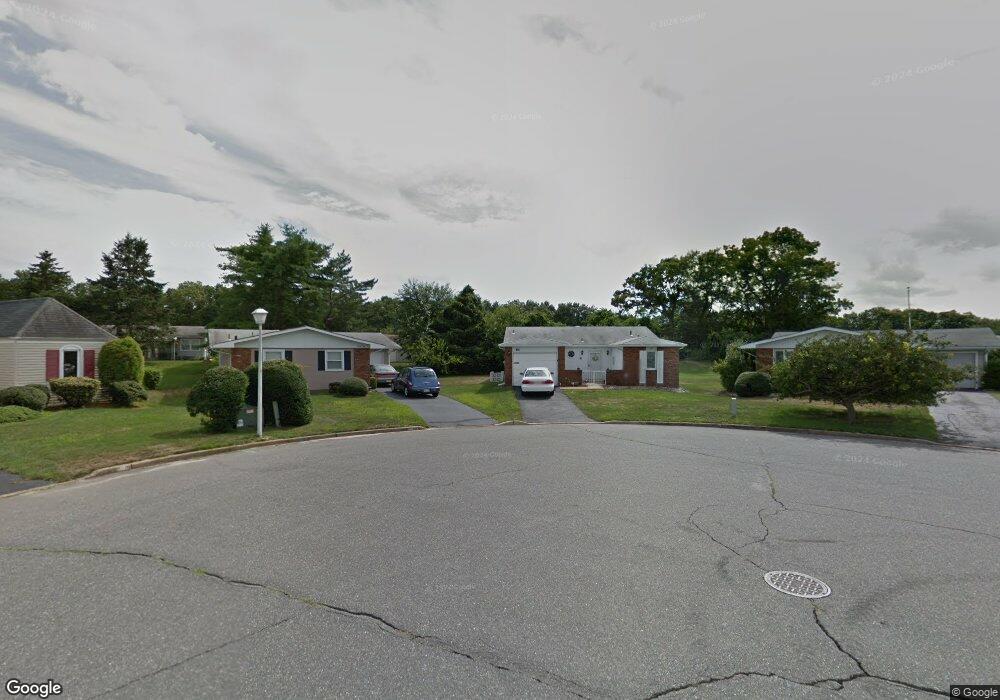
This home is located at 60 Sidney Ct, Brick, NJ 08724 and is currently estimated at $403,377, approximately $294 per square foot. 60 Sidney Ct is a home located in Ocean County with nearby schools including Lanes Mill Elementary School, Veterans Memorial Middle School, and Brick Township Memorial High School.
Ownership History
Date
Name
Owned For
Owner Type
Purchase Details
Closed on
May 23, 2011
Sold by
Federal National Mortgage Association
Bought by
Scarano Ann
Current Estimated Value
Home Financials for this Owner
Home Financials are based on the most recent Mortgage that was taken out on this home.
Original Mortgage
$81,103
Interest Rate
5.37%
Mortgage Type
FHA
Purchase Details
Closed on
Nov 8, 2010
Sold by
Nationstar Mortgage Llc
Bought by
Federal National Mortgage Association
Purchase Details
Closed on
Nov 5, 2010
Sold by
Taub Robert S
Bought by
Nationstar Mortgage Llc
Purchase Details
Closed on
May 9, 2007
Sold by
Brown Margaret F and Molinelli Steven J
Bought by
Taub Robert S
Home Financials for this Owner
Home Financials are based on the most recent Mortgage that was taken out on this home.
Original Mortgage
$200,000
Interest Rate
6.21%
Mortgage Type
Purchase Money Mortgage
Create a Home Valuation Report for This Property
The Home Valuation Report is an in-depth analysis detailing your home's value as well as a comparison with similar homes in the area
Home Values in the Area
Average Home Value in this Area
Purchase History
| Date | Buyer | Sale Price | Title Company |
|---|---|---|---|
| Scarano Ann | $93,500 | First American Title Ins Co | |
| Federal National Mortgage Association | -- | None Available | |
| Nationstar Mortgage Llc | -- | None Available | |
| Taub Robert S | $200,000 | Ocean Title Service Inc |
Source: Public Records
Mortgage History
| Date | Status | Borrower | Loan Amount |
|---|---|---|---|
| Previous Owner | Scarano Ann | $81,103 | |
| Previous Owner | Taub Robert S | $200,000 |
Source: Public Records
Tax History Compared to Growth
Tax History
| Year | Tax Paid | Tax Assessment Tax Assessment Total Assessment is a certain percentage of the fair market value that is determined by local assessors to be the total taxable value of land and additions on the property. | Land | Improvement |
|---|---|---|---|---|
| 2025 | $3,456 | $132,400 | $40,000 | $92,400 |
| 2024 | $3,280 | $132,400 | $40,000 | $92,400 |
| 2023 | $3,232 | $132,400 | $40,000 | $92,400 |
| 2022 | $3,232 | $132,400 | $40,000 | $92,400 |
| 2021 | $3,164 | $132,400 | $40,000 | $92,400 |
| 2020 | $3,123 | $132,400 | $40,000 | $92,400 |
| 2019 | $3,068 | $132,400 | $40,000 | $92,400 |
| 2018 | $2,998 | $132,400 | $40,000 | $92,400 |
| 2017 | $2,917 | $132,400 | $40,000 | $92,400 |
| 2016 | $2,901 | $132,400 | $40,000 | $92,400 |
| 2015 | $2,825 | $132,400 | $40,000 | $92,400 |
| 2014 | $2,802 | $132,400 | $40,000 | $92,400 |
Source: Public Records
Map
Nearby Homes