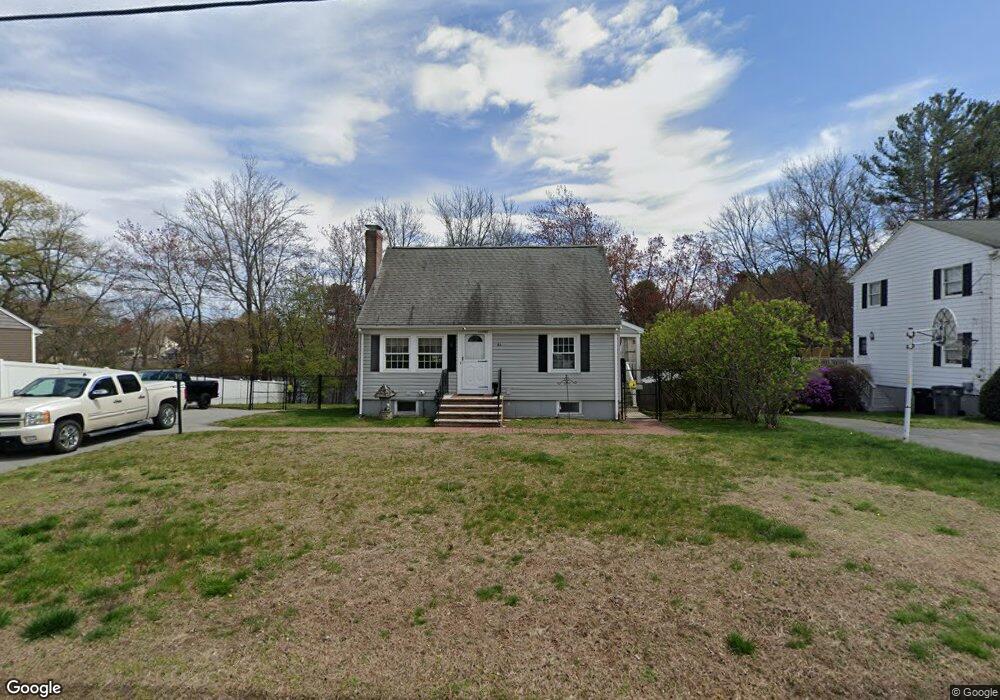
60 Simpson Dr Framingham, MA 01701
Nobscot NeighborhoodEstimated Value: $599,000 - $618,000
About This Home
This home is located at 60 Simpson Dr, Framingham, MA 01701 and is currently estimated at $608,473, approximately $482 per square foot. 60 Simpson Dr is a home located in Middlesex County with nearby schools including Framingham High School, MetroWest Jewish Day School, and Saint Bridget School.
Ownership History
We collect this data history from publicly available records. To have your information removed, we recommend requesting removal directly through your county’s website.
Purchase Details
Purchase Details
Home Values in the Area
Average Home Value in this Area
Purchase History
We collect this data history from publicly available records. To have your information removed, we recommend requesting removal directly through your county’s website.
| Date | Buyer | Sale Price | Title Company |
|---|---|---|---|
| -- | -- | ||
| $215,000 | -- |
Mortgage History
We collect this data history from publicly available records. To have your information removed, we recommend requesting removal directly through your county’s website.
| Date | Status | Borrower | Loan Amount |
|---|---|---|---|
| Previous Owner | $160,000 | ||
| Previous Owner | $100,000 |
Tax History
We collect this data history from publicly available records. To have your information removed, we recommend requesting removal directly through your county’s website.
| Year | Tax Paid | Tax Assessment Tax Assessment Total Assessment is a certain percentage of the fair market value that is determined by local assessors to be the total taxable value of land and additions on the property. | Land | Improvement |
|---|---|---|---|---|
| 2025 | $6,695 | $560,700 | $260,800 | $299,900 |
| 2024 | $6,544 | $525,200 | $232,900 | $292,300 |
| 2023 | $6,240 | $476,700 | $207,900 | $268,800 |
| 2022 | $5,904 | $429,700 | $188,600 | $241,100 |
| 2021 | $5,009 | $356,500 | $181,300 | $175,200 |
| 2020 | $5,018 | $335,000 | $164,800 | $170,200 |
| 2019 | $4,897 | $318,400 | $164,800 | $153,600 |
| 2018 | $4,810 | $294,700 | $158,600 | $136,100 |
| 2017 | $4,697 | $281,100 | $154,000 | $127,100 |
| 2016 | $4,521 | $260,100 | $154,000 | $106,100 |
| 2015 | $4,469 | $250,800 | $154,300 | $96,500 |
Map
- 14 Paxton Rd
- 163 Water St
- 12 Swanson Rd
- 8 Fairbrook Rd
- 11 Geraldine Rd
- 9 Park Ave
- 57 Prior Dr
- 94 Fenwick St
- 81 Nicholas Rd Unit H
- 79 Nicholas Rd Unit H
- 75 Nicholas Rd Unit G
- 19 Chestnut St
- 102 Cherry St
- 17 Clara Rd
- 30 A St
- 9 Upper Joclyn Ave
- 5 Perry Henderson Dr
- 55 Joclyn Ave
- 15 Michael Rd
- 67 Leigh St
Ask me questions while you tour the home.