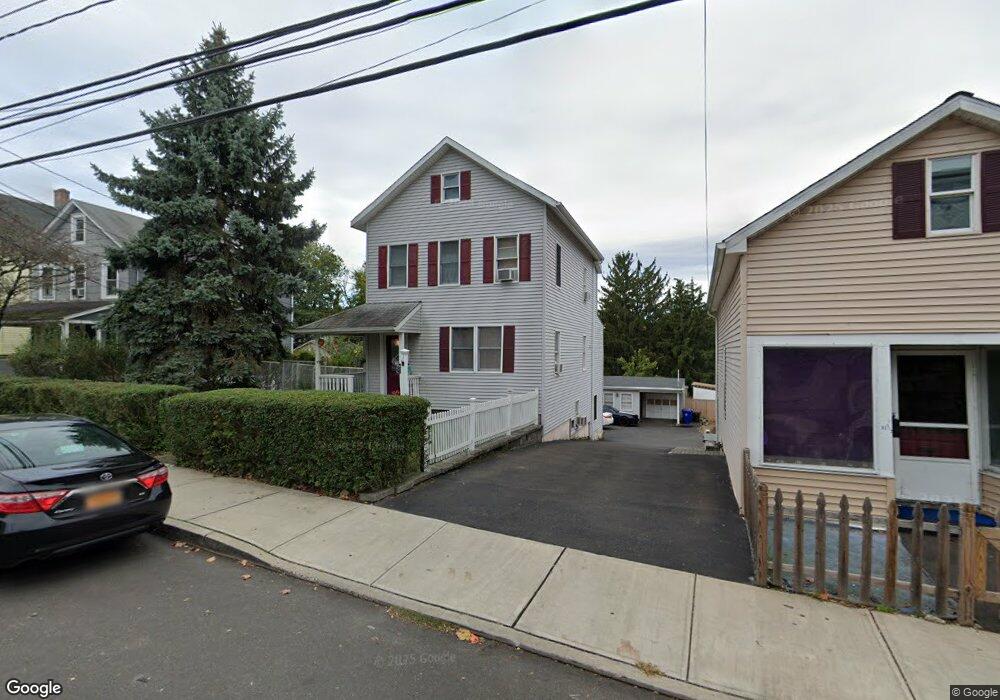
60 Taylor Ave Norwalk, CT 06854
Brookside NeighborhoodEstimated Value: $607,000 - $3,262,000
9
Beds
6
Baths
5,292
Sq Ft
$253/Sq Ft
Est. Value
About This Home
This home is located at 60 Taylor Ave, Norwalk, CT 06854 and is currently estimated at $1,340,117, approximately $253 per square foot. 60 Taylor Ave is a home located in Fairfield County with nearby schools including Kendall Elementary School, Ponus Ridge Middle School, and Brien Mcmahon High School.
Ownership History
Date
Name
Owned For
Owner Type
Purchase Details
Closed on
Nov 21, 2024
Sold by
Chowdhury Rashedul H and Begum Momtaz
Bought by
60 Taylor Ave Llc
Current Estimated Value
Home Financials for this Owner
Home Financials are based on the most recent Mortgage that was taken out on this home.
Original Mortgage
$693,750
Outstanding Balance
$687,372
Interest Rate
6.54%
Mortgage Type
Stand Alone Refi Refinance Of Original Loan
Estimated Equity
$652,745
Purchase Details
Closed on
Jul 13, 2015
Sold by
Watson Barry and Kalmanides Helen
Bought by
Begum Momtaz and Chowdhury Rashedul
Home Financials for this Owner
Home Financials are based on the most recent Mortgage that was taken out on this home.
Original Mortgage
$387,845
Interest Rate
3.87%
Mortgage Type
New Conventional
Create a Home Valuation Report for This Property
The Home Valuation Report is an in-depth analysis detailing your home's value as well as a comparison with similar homes in the area
Home Values in the Area
Average Home Value in this Area
Purchase History
| Date | Buyer | Sale Price | Title Company |
|---|---|---|---|
| 60 Taylor Ave Llc | -- | None Available | |
| 60 Taylor Ave Llc | -- | None Available | |
| Begum Momtaz | $395,000 | -- | |
| Begum Momtaz | $395,000 | -- |
Source: Public Records
Mortgage History
| Date | Status | Borrower | Loan Amount |
|---|---|---|---|
| Open | 60 Taylor Ave Llc | $693,750 | |
| Closed | 60 Taylor Ave Llc | $693,750 | |
| Previous Owner | Begum Momtaz | $387,845 |
Source: Public Records
Tax History
| Year | Tax Paid | Tax Assessment Tax Assessment Total Assessment is a certain percentage of the fair market value that is determined by local assessors to be the total taxable value of land and additions on the property. | Land | Improvement |
|---|---|---|---|---|
| 2025 | $11,850 | $495,810 | $120,550 | $375,260 |
| 2024 | $11,674 | $495,810 | $120,550 | $375,260 |
| 2023 | $8,083 | $322,230 | $82,880 | $239,350 |
| 2022 | $7,909 | $322,230 | $82,880 | $239,350 |
| 2021 | $7,724 | $322,230 | $82,880 | $239,350 |
| 2020 | $7,719 | $322,230 | $82,880 | $239,350 |
| 2019 | $7,233 | $310,230 | $82,880 | $227,350 |
| 2018 | $6,720 | $252,590 | $100,910 | $151,680 |
| 2017 | $6,022 | $234,490 | $100,910 | $133,580 |
| 2016 | $4,871 | $191,470 | $100,910 | $90,560 |
| 2015 | $4,858 | $191,470 | $100,910 | $90,560 |
| 2014 | -- | $234,490 | $100,910 | $133,580 |
Source: Public Records
Map
Nearby Homes
- 6 W Couch St
- 47 Taylor Ave
- 10 Keith St
- 6 Norton Place
- 39 Bayview Ave
- 187 Flax Hill Rd Unit D5
- 8 Taylor Ave Unit 2
- 5 Mcallister Ave
- 115 Flax Hill Rd Unit 6
- 61 Cedar St
- 225 Flax Hill Rd Unit 2
- 4 Senga Rd
- 22 Doctor Martin Luther King Junior Dr Unit B1
- 15 Madison St Unit B7
- 34 Ferris Ave Unit A2
- 1618 Ann St Unit 22
- 94 Washington St Unit 6
- 94 Washington St Unit 20
- 83 Washington St Unit 3C
- 32 Pine St Unit 27
Your Personal Tour Guide
Ask me questions while you tour the home.