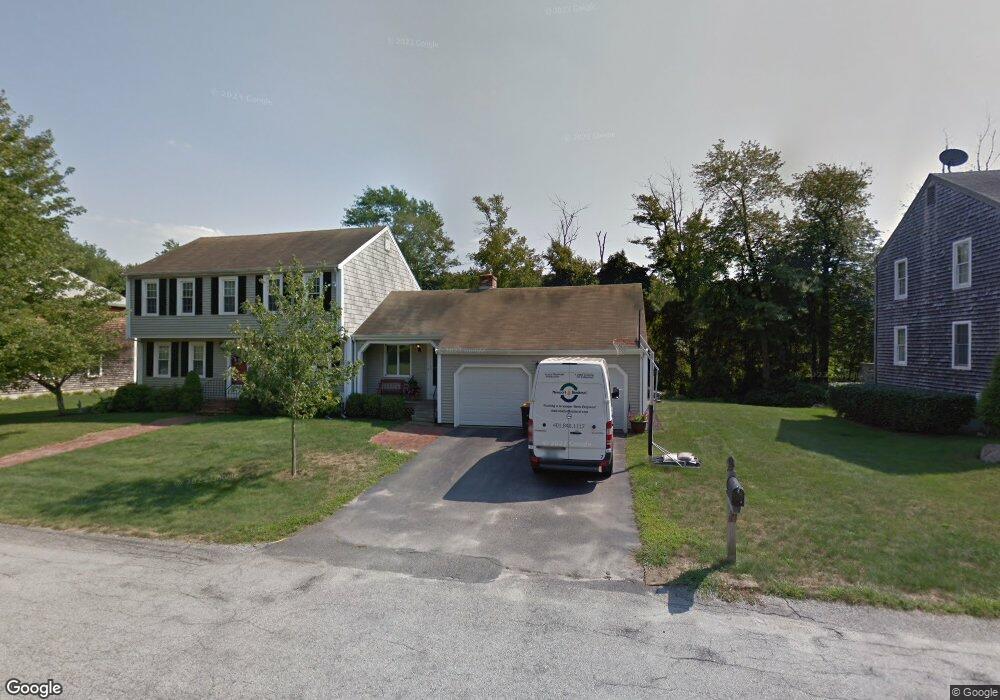
60 Tommy Marks Way South Weymouth, MA 02190
South Weymouth NeighborhoodEstimated Value: $822,000 - $954,000
3
Beds
3
Baths
1,966
Sq Ft
$450/Sq Ft
Est. Value
About This Home
This home is located at 60 Tommy Marks Way, South Weymouth, MA 02190 and is currently estimated at $883,911, approximately $449 per square foot. 60 Tommy Marks Way is a home located in Norfolk County with nearby schools including Thomas V Nash, Abigail Adams Middle School, and Weymouth Middle School Chapman.
Ownership History
Date
Name
Owned For
Owner Type
Purchase Details
Closed on
Aug 15, 2001
Sold by
Brooks Terrance M and Brooks Janet L
Bought by
Siegfried John and Siegfried Maria
Current Estimated Value
Home Financials for this Owner
Home Financials are based on the most recent Mortgage that was taken out on this home.
Original Mortgage
$230,000
Outstanding Balance
$89,784
Interest Rate
7.16%
Mortgage Type
Purchase Money Mortgage
Estimated Equity
$794,127
Create a Home Valuation Report for This Property
The Home Valuation Report is an in-depth analysis detailing your home's value as well as a comparison with similar homes in the area
Home Values in the Area
Average Home Value in this Area
Purchase History
| Date | Buyer | Sale Price | Title Company |
|---|---|---|---|
| Siegfried John | $399,900 | -- |
Source: Public Records
Mortgage History
| Date | Status | Borrower | Loan Amount |
|---|---|---|---|
| Open | Siegfried John | $230,000 |
Source: Public Records
Tax History Compared to Growth
Tax History
| Year | Tax Paid | Tax Assessment Tax Assessment Total Assessment is a certain percentage of the fair market value that is determined by local assessors to be the total taxable value of land and additions on the property. | Land | Improvement |
|---|---|---|---|---|
| 2025 | $7,876 | $779,800 | $239,500 | $540,300 |
| 2024 | $7,607 | $740,700 | $228,100 | $512,600 |
| 2023 | $7,414 | $709,500 | $230,500 | $479,000 |
| 2022 | $7,248 | $632,500 | $213,400 | $419,100 |
| 2021 | $6,654 | $566,800 | $213,400 | $353,400 |
| 2020 | $6,352 | $532,900 | $213,400 | $319,500 |
| 2019 | $6,245 | $515,300 | $205,200 | $310,100 |
| 2018 | $6,036 | $482,900 | $195,400 | $287,500 |
| 2017 | $5,894 | $460,100 | $186,100 | $274,000 |
| 2016 | $5,710 | $446,100 | $179,000 | $267,100 |
| 2015 | $5,448 | $422,300 | $179,000 | $243,300 |
| 2014 | $5,216 | $392,200 | $166,600 | $225,600 |
Source: Public Records
Map
Nearby Homes
- 68 Massapoag St Unit 7
- 308 Forest St
- 16 Jay Rd
- 24 Fisher Rd
- 354 Tilden Commons Ln
- 92 Mercury St
- 134 Tyson Commons Ln
- 175 Tyson Commons Ln
- 30 Bradford Commons Ln
- 262 West St
- 255 West St
- 211 Randolph St
- 193 Randolph St
- 655 Summer St
- 120 Randolph St
- 441 Grove St
- 432 Grove St
- 50 Hollis St
- 2 Mitchell Ln Unit B
- 972 Liberty St
- 70 Tommy Marks Way
- 50 Tommy Marks Way
- 65 Tommy Marks Way
- 49 Tommy Marks Way
- 69 Tommy Marks Way
- 40 Tommy Marks Way
- 76 Tommy Marks Way
- 39 Tommy Marks Way
- 80 Tommy Marks Way
- 77 Tommy Marks Way
- 32 Tommy Marks Way
- 27 Tommy Marks Way
- 24 Harvest Ln
- 24 Tommy Marks Way
- 39 Massapoag St
- 16 Harvest Ln
- 29 Harvest Ln
- 67 Massapoag St Unit 2
- 51 Massapoag St
- 79 Massapoag St