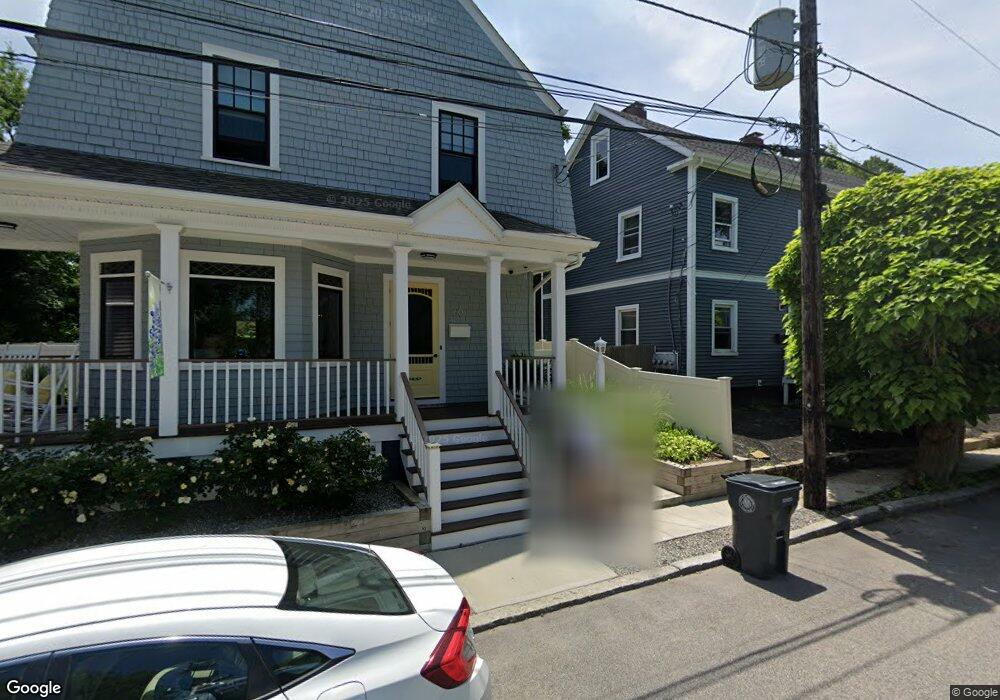
60 Tucker Ave Cranston, RI 02905
Edgewood NeighborhoodEstimated Value: $535,390 - $939,000
3
Beds
2
Baths
1,933
Sq Ft
$361/Sq Ft
Est. Value
About This Home
This home is located at 60 Tucker Ave, Cranston, RI 02905 and is currently estimated at $697,598, approximately $360 per square foot. 60 Tucker Ave is a home located in Providence County with nearby schools including Edward S. Rhodes School, Park View Middle School, and Cranston High School East.
Ownership History
Date
Name
Owned For
Owner Type
Purchase Details
Closed on
May 13, 2024
Sold by
Florio William J and Coonan Annamarie E
Bought by
Florio William J and Coonan Annamarie E
Current Estimated Value
Purchase Details
Closed on
Dec 13, 2018
Sold by
Vurgess Elaine D
Bought by
Vivenzio Elaine
Purchase Details
Closed on
Jun 23, 2010
Sold by
Minter Dwight and Minter Marilyn
Bought by
Burgess Elaine D
Purchase Details
Closed on
Jul 21, 2004
Sold by
Farrar Marilyn and Hartley Jared
Bought by
Minter Dwight and Minter Marilyn
Home Financials for this Owner
Home Financials are based on the most recent Mortgage that was taken out on this home.
Original Mortgage
$182,000
Interest Rate
6.28%
Mortgage Type
Purchase Money Mortgage
Create a Home Valuation Report for This Property
The Home Valuation Report is an in-depth analysis detailing your home's value as well as a comparison with similar homes in the area
Home Values in the Area
Average Home Value in this Area
Purchase History
We collect this data history from publicly available records. To have your information removed, we recommend requesting removal directly through your county’s website.
| Date | Buyer | Sale Price | Title Company |
|---|---|---|---|
| Florio William J | -- | None Available | |
| Florio William J | -- | None Available | |
| Vivenzio Elaine | -- | -- | |
| Vivenzio Elaine | -- | -- | |
| Burgess Elaine D | $255,000 | -- | |
| Burgess Elaine D | $255,000 | -- | |
| Minter Dwight | $228,000 | -- | |
| Minter Dwight | $228,000 | -- |
Source: Public Records
Mortgage History
We collect this data history from publicly available records. To have your information removed, we recommend requesting removal directly through your county’s website.
| Date | Status | Borrower | Loan Amount |
|---|---|---|---|
| Previous Owner | Minter Dwight | $182,000 |
Source: Public Records
Tax History
| Year | Tax Paid | Tax Assessment Tax Assessment Total Assessment is a certain percentage of the fair market value that is determined by local assessors to be the total taxable value of land and additions on the property. | Land | Improvement |
|---|---|---|---|---|
| 2025 | $5,738 | $413,400 | $125,000 | $288,400 |
| 2024 | $5,626 | $413,400 | $125,000 | $288,400 |
| 2023 | $5,659 | $299,400 | $89,400 | $210,000 |
| 2022 | $5,542 | $299,400 | $89,400 | $210,000 |
| 2021 | $5,103 | $283,500 | $89,400 | $194,100 |
| 2020 | $5,109 | $246,000 | $92,600 | $153,400 |
| 2019 | $4,922 | $237,000 | $92,600 | $144,400 |
| 2018 | $4,809 | $237,000 | $92,600 | $144,400 |
| 2017 | $4,762 | $207,600 | $86,200 | $121,400 |
| 2016 | $4,661 | $207,600 | $86,200 | $121,400 |
| 2015 | $4,661 | $207,600 | $86,200 | $121,400 |
| 2014 | $4,241 | $185,700 | $73,400 | $112,300 |
Source: Public Records
Map
Nearby Homes
- 0 Remington St
- 41 Berwick Ln
- 23 Lawn Ave
- 200 Post Rd Unit 610
- 200 Post Rd Unit 319
- 107 Massasoit Ave
- 188 Fair St
- 10 Manse Ct
- 18 Bow St
- 18 Harding Ave
- 161 Adams St
- 115 Irving Rd
- 150 Albert Ave
- 27 Cliffdale Ave
- 20 Henry St
- 31 Denver Ave
- 99 Dryden Blvd
- 400 Narragansett Pkwy Unit NB1
- 400 Narragansett Pkwy Unit ND9
- 171 Arnold Ave Unit B
Your Personal Tour Guide
Ask me questions while you tour the home.