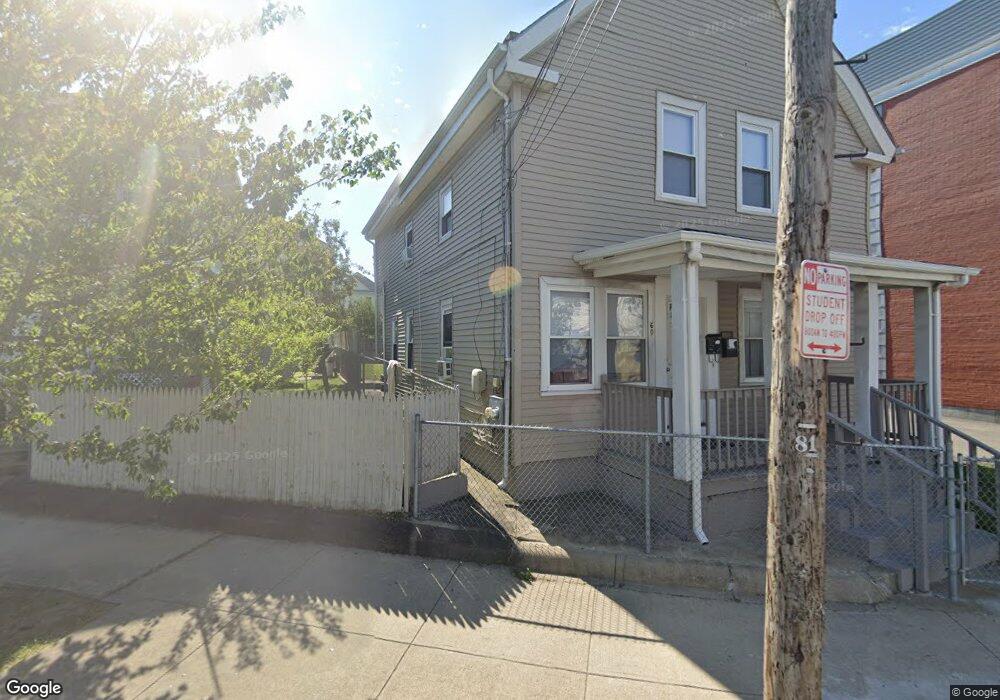
60 Union Ave Providence, RI 02909
West End NeighborhoodEstimated Value: $365,000 - $559,000
5
Beds
2
Baths
1,968
Sq Ft
$242/Sq Ft
Est. Value
About This Home
This home is located at 60 Union Ave, Providence, RI 02909 and is currently estimated at $476,544, approximately $242 per square foot. 60 Union Ave is a home located in Providence County with nearby schools including Asa Messer Elementary School, Charles N. Fortes Elementary School, and Alfred Lima Sr. Elementary School.
Ownership History
Date
Name
Owned For
Owner Type
Purchase Details
Closed on
Apr 3, 2013
Sold by
Sen Sokha
Bought by
Sen Khorn and Sen Sokha
Current Estimated Value
Home Financials for this Owner
Home Financials are based on the most recent Mortgage that was taken out on this home.
Original Mortgage
$109,971
Outstanding Balance
$77,744
Interest Rate
3.58%
Estimated Equity
$398,800
Purchase Details
Closed on
Oct 25, 2011
Sold by
Sen Khorn
Bought by
Sen Sokha
Purchase Details
Closed on
Apr 1, 2002
Sold by
Ne Properties
Bought by
Sen Khorn
Purchase Details
Closed on
Dec 19, 2001
Sold by
Smith William J
Bought by
Ne Properties
Create a Home Valuation Report for This Property
The Home Valuation Report is an in-depth analysis detailing your home's value as well as a comparison with similar homes in the area
Home Values in the Area
Average Home Value in this Area
Purchase History
| Date | Buyer | Sale Price | Title Company |
|---|---|---|---|
| Sen Khorn | -- | -- | |
| Sen Khorn | -- | -- | |
| Sen Khorn | -- | -- | |
| Sen Sokha | -- | -- | |
| Sen Sokha | -- | -- | |
| Sen Khorn | $100,000 | -- | |
| Sen Khorn | $100,000 | -- | |
| Ne Properties | $30,000 | -- | |
| Ne Properties | $30,000 | -- |
Source: Public Records
Mortgage History
| Date | Status | Borrower | Loan Amount |
|---|---|---|---|
| Open | Sen Khorn | $109,971 | |
| Closed | Ne Properties | $109,971 |
Source: Public Records
Tax History Compared to Growth
Tax History
| Year | Tax Paid | Tax Assessment Tax Assessment Total Assessment is a certain percentage of the fair market value that is determined by local assessors to be the total taxable value of land and additions on the property. | Land | Improvement |
|---|---|---|---|---|
| 2025 | $2,960 | $392,000 | $110,900 | $281,100 |
| 2024 | $4,892 | $266,600 | $74,000 | $192,600 |
| 2023 | $4,892 | $266,600 | $74,000 | $192,600 |
| 2022 | $4,745 | $266,600 | $74,000 | $192,600 |
| 2021 | $3,605 | $146,800 | $36,500 | $110,300 |
| 2020 | $3,605 | $146,800 | $36,500 | $110,300 |
| 2019 | $3,605 | $146,800 | $36,500 | $110,300 |
| 2018 | $3,973 | $124,300 | $36,200 | $88,100 |
| 2017 | $3,973 | $124,300 | $36,200 | $88,100 |
| 2016 | $3,973 | $124,300 | $36,200 | $88,100 |
| 2015 | $3,611 | $109,100 | $36,200 | $72,900 |
| 2014 | $3,682 | $109,100 | $36,200 | $72,900 |
| 2013 | $3,682 | $109,100 | $36,200 | $72,900 |
Source: Public Records
Map
Nearby Homes
- 56 Union Ave
- 59 Union Ave
- 224 Waverly St
- 65 Union Ave Unit 1
- 65 Union Ave Unit 2
- 67 Union Ave
- 231 Althea St
- 220 Waverly St
- 73 Union Ave
- 229 Waverly St
- 48 Union Ave
- 233 Waverly St
- 47 Union Ave
- 235 Waverly St
- 227 Althea St
- 79 Union Ave
- 8284 Ellery St
- 242 Althea St
- 238 Althea St Unit 240
- 238 Althea St Unit 3