Estimated Value: $355,000 - $386,000
4
Beds
2
Baths
2,652
Sq Ft
$138/Sq Ft
Est. Value
About This Home
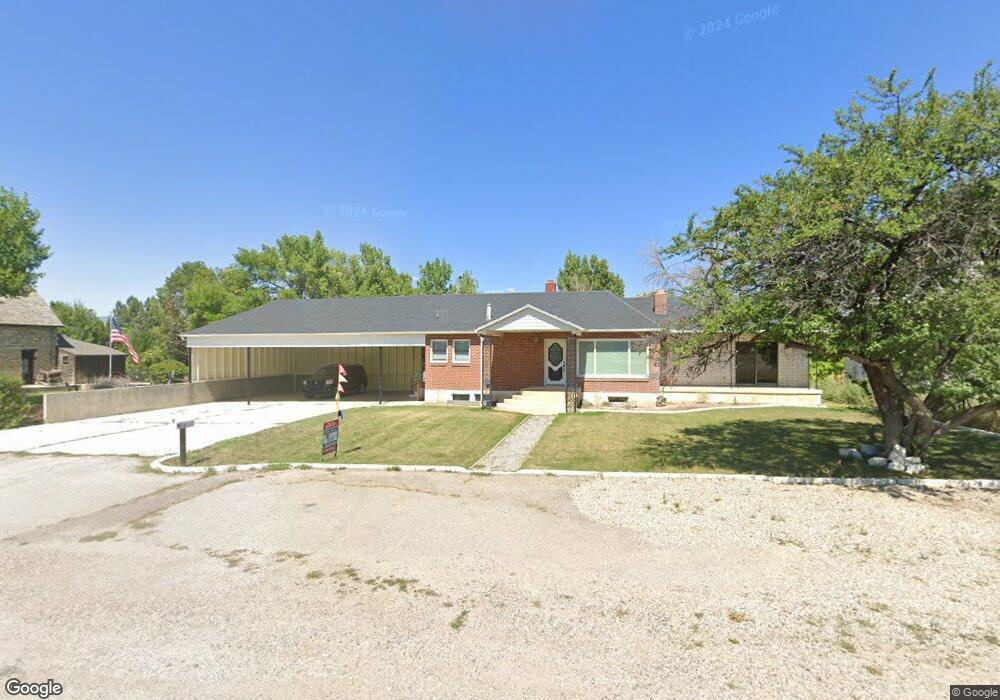
This home is located at 60 W 300 N, Manti, UT 84642 and is currently estimated at $367,278, approximately $138 per square foot. 60 W 300 N is a home located in Sanpete County.
Ownership History
Date
Name
Owned For
Owner Type
Purchase Details
Closed on
Nov 14, 2024
Sold by
Draper Carson
Bought by
Ziegler Dave
Current Estimated Value
Home Financials for this Owner
Home Financials are based on the most recent Mortgage that was taken out on this home.
Original Mortgage
$296,000
Outstanding Balance
$293,053
Interest Rate
6.12%
Mortgage Type
Construction
Estimated Equity
$74,225
Purchase Details
Closed on
Jul 13, 2020
Sold by
Anderson and Shaylee
Bought by
Carson Draper
Purchase Details
Closed on
Jan 8, 2016
Sold by
Kenneth Walser and Kenneth Susie J
Bought by
Anderson Jeremy
Create a Home Valuation Report for This Property
The Home Valuation Report is an in-depth analysis detailing your home's value as well as a comparison with similar homes in the area
Home Values in the Area
Average Home Value in this Area
Purchase History
| Date | Buyer | Sale Price | Title Company |
|---|---|---|---|
| Ziegler Dave | $370,000 | First American-Ephraim | |
| Carson Draper | -- | First American-Ephraim | |
| Anderson Jeremy | $125,000 | Central Utah Title |
Source: Public Records
Mortgage History
| Date | Status | Borrower | Loan Amount |
|---|---|---|---|
| Open | Ziegler Dave | $296,000 |
Source: Public Records
Tax History Compared to Growth
Tax History
| Year | Tax Paid | Tax Assessment Tax Assessment Total Assessment is a certain percentage of the fair market value that is determined by local assessors to be the total taxable value of land and additions on the property. | Land | Improvement |
|---|---|---|---|---|
| 2024 | $1,849 | $177,654 | $0 | $0 |
| 2023 | $1,840 | $166,811 | $0 | $0 |
| 2022 | $1,709 | $141,277 | $0 | $0 |
| 2021 | $1,616 | $115,647 | $0 | $0 |
| 2020 | $1,507 | $101,394 | $0 | $0 |
| 2019 | $1,426 | $94,284 | $0 | $0 |
| 2018 | $1,438 | $167,104 | $28,809 | $138,295 |
| 2017 | $1,273 | $85,627 | $0 | $0 |
| 2016 | $1,202 | $80,864 | $0 | $0 |
| 2015 | $1,207 | $80,864 | $0 | $0 |
| 2014 | $1,184 | $80,864 | $0 | $0 |
| 2013 | $1,173 | $80,650 | $0 | $0 |
Source: Public Records
Map
Nearby Homes